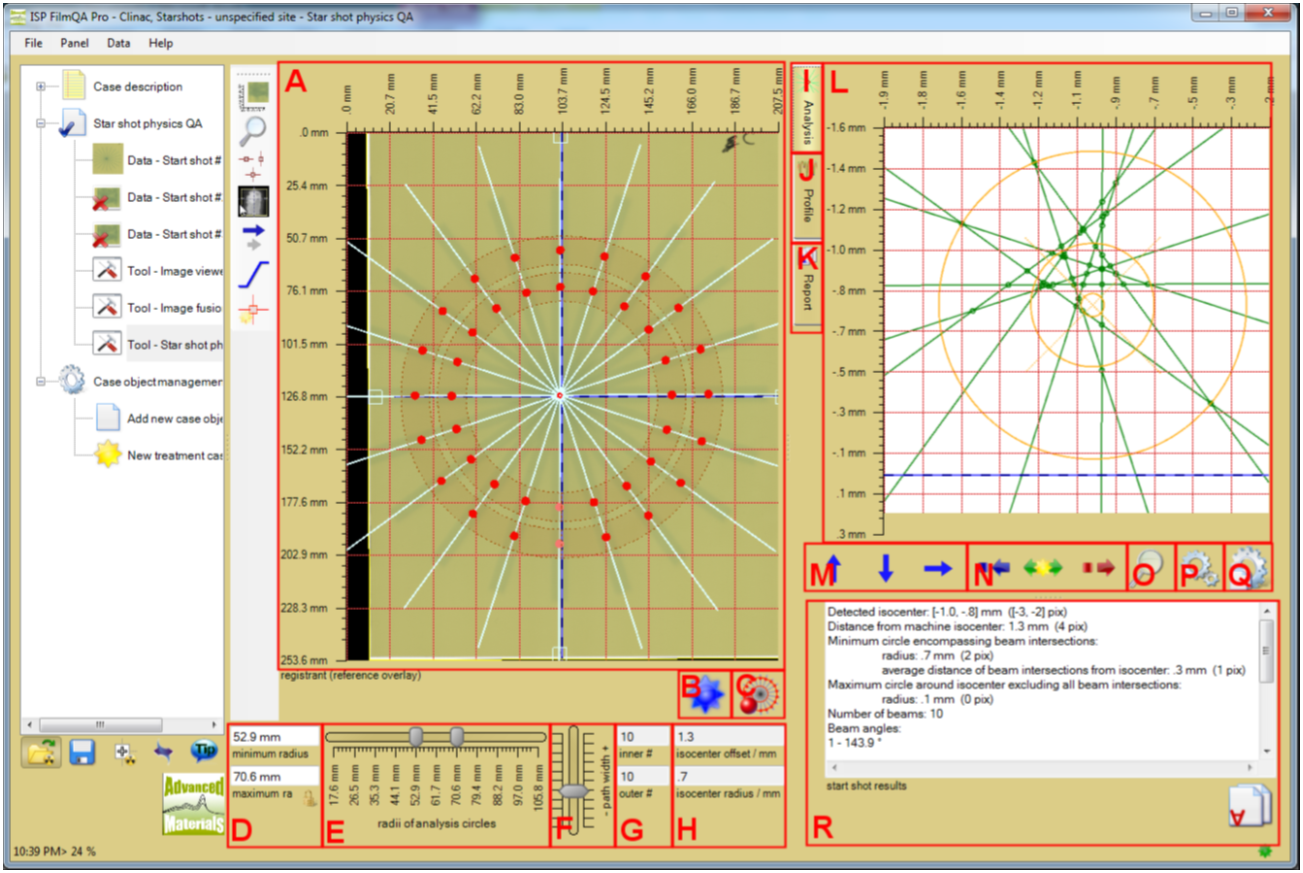
A. Star Shot Chart
Star shot image with analysis path circles including path average region, detected beam lines and resulting isocenter circle (minimum circle including all beam intersections)
B. Update Button
When clicked forces update of all star shot analysis data.
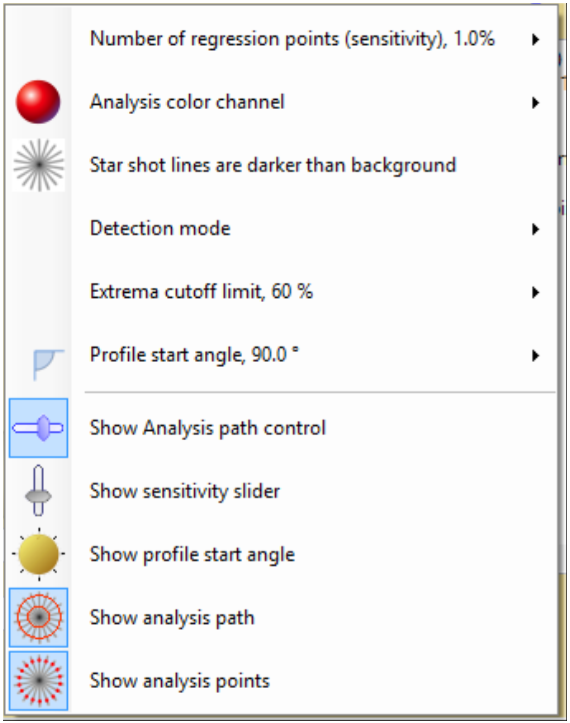
C. Detection Options Button
D. Minimum/maximum radius
Numerical values of the analysis path circles radii.
E. Radii of analysis path circles
Double slider to adjust radii of analysis path circles.
F. Path width
Width of the average range of the analysis path circles.
G. Inner/outer #
Number of detected beam lines at inner and outer analysis path
H. Isocenter offset and radius
Radius of the minimum circle including all beam line intersections and its offset with respect to the machine isocenter
I. Analysis Analysis tool tab Analysis tool is shown above as L.
J. Profile Profile tool tab
Tool shows profiles along analysis path circles and detected beam line points.
K. Report Report tool tab
Summarizes star shot analysis data in a report document to be saved to file (e.g. pdf) or copied and pasted to other applications.
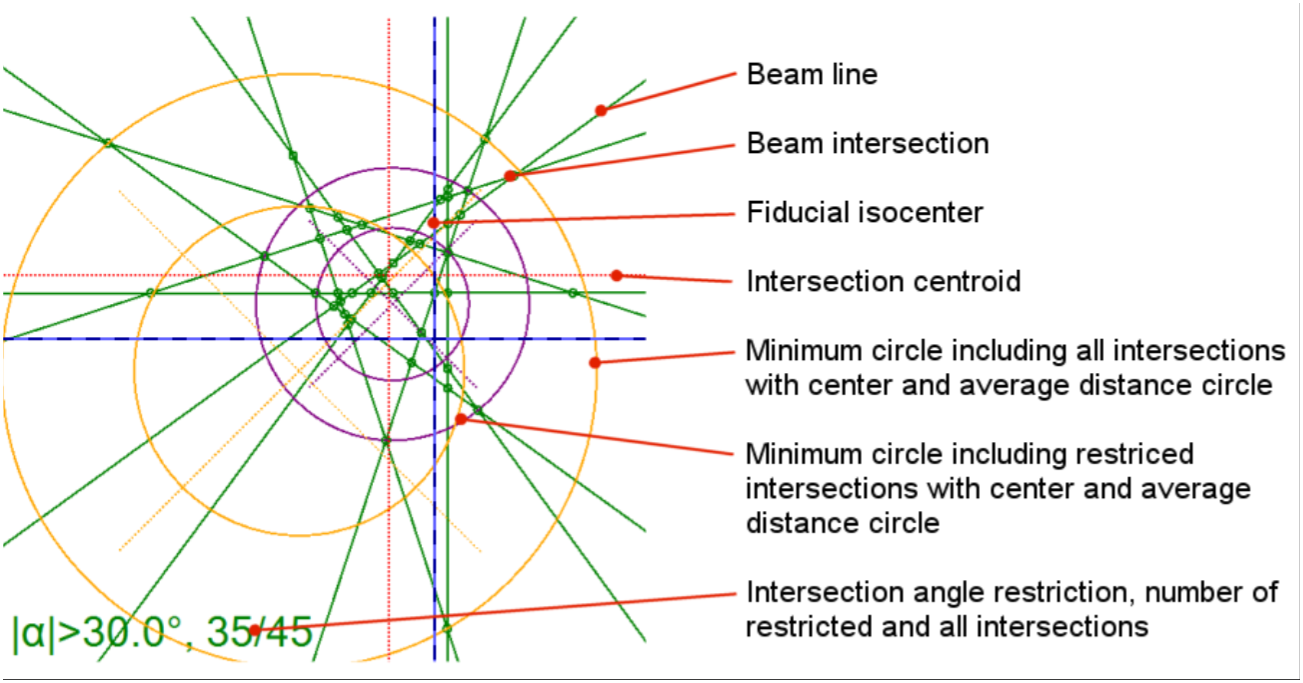
L. Star shot analysis
Chart showing detected beam lines, intersection points of the beam lines, smallest circle including all intersection points, detected isocenter (defined by previous circle), circle with average distance from detected isocenter, biggest circle around detected isocenter excluding all intersection points and machine isocenter (defined by fiducials).
M. Arrow buttons
When clicked moves shown image clipping region in the direction of the depicted arrow.
N. Adjustment buttons
 Reduce size of clipping region.
 Auto size clipping region to include all chart items.
 Inflate size of clipping region.
O. Magnifier button
Magnifies shown images. It does not change the size of the clipping region.
P. Drawing options button
Change chart colors and line width.
Q. Copy setting button
Copies current chart setting to the reporting tool.
R. Star shot results
Summary of the star shot analysis including isocenter coordinates relative to machine isocenter, radii of the analysis circles (minimum, average and maximum circle with respect to beam intersection points) and angles of the detected beam lines.
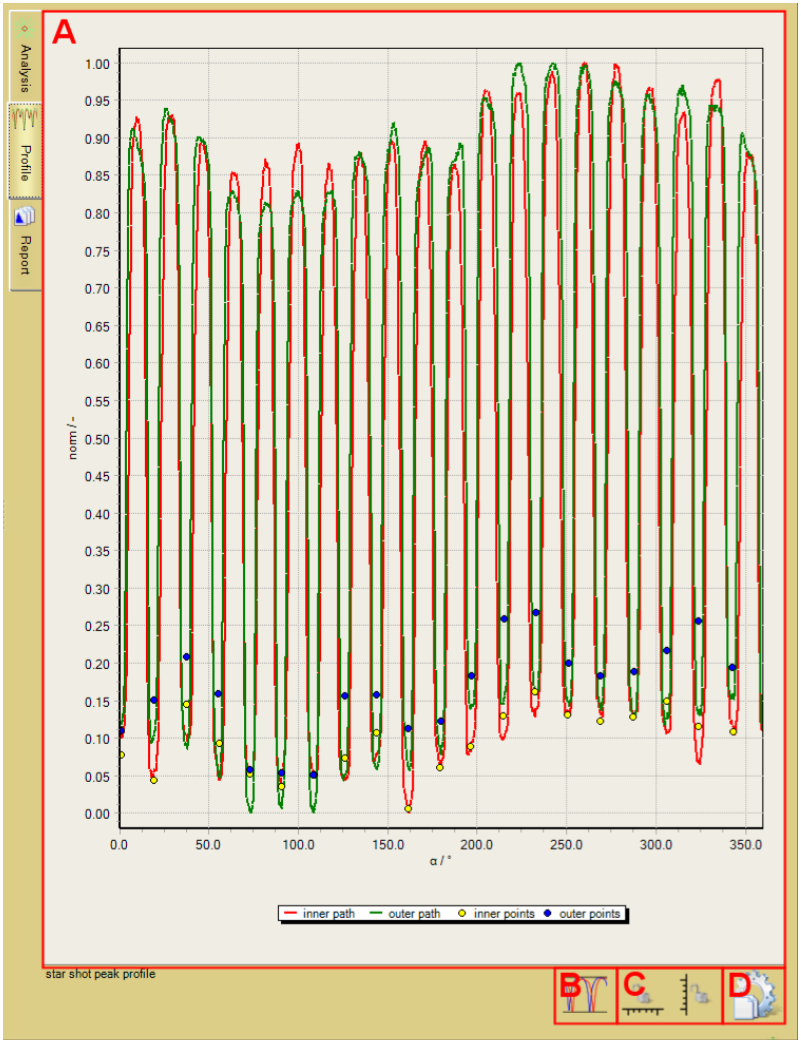
Profiling along the analysis path to verify quality of the detected intersection points between beam lines and analysis circles. Smoothness of the profile data can be increased by widening the averaging range of the path circles.
A. Star shot peak profile
Chart showing color channel values along both analysis path circles and the locations of the detected beam line points (minima when darker otherwise maxima). Data are shown as function of circle angles.
B. Profile normalization button
Toggles between normalized data (profile is normalized to [0,1] interval) and color channel value data.
C. Axis lock buttons
 Lock or unlock chart x axis (angle of analysis circles).
 Lock or unlock chart y axis (normalized or color channel value).
Right click for more options.
D. Copy setting button
Copies current chart setting to the reporting tool.
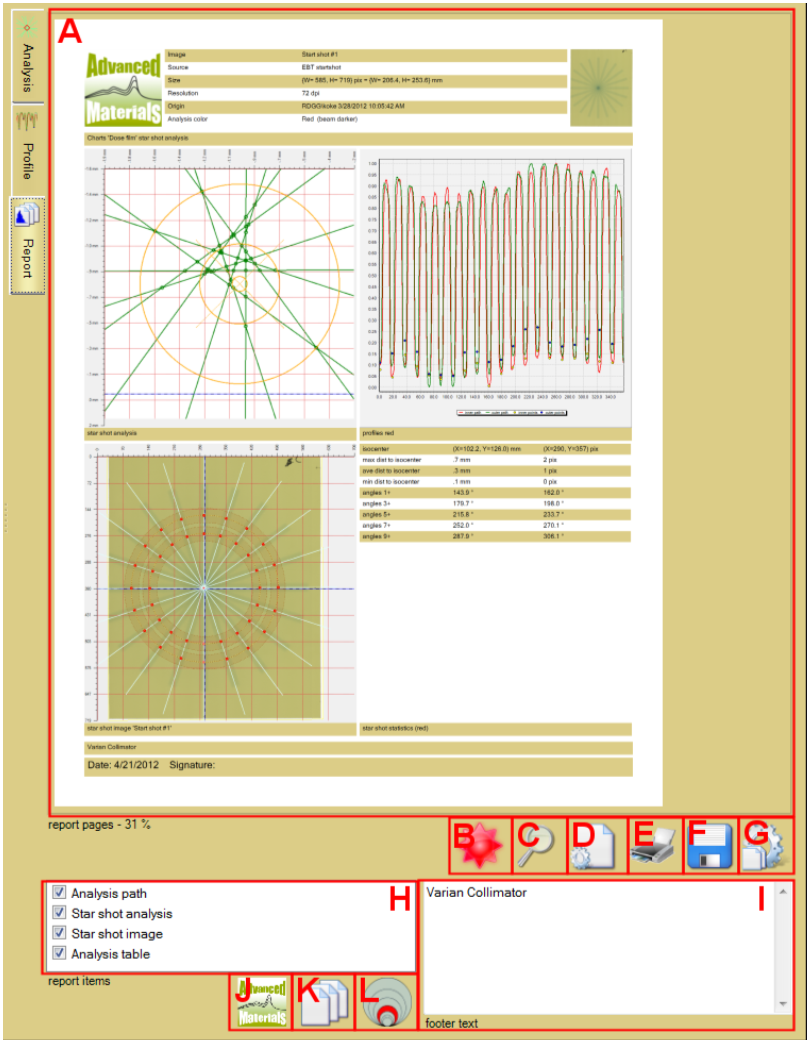
Create report document including the star shot analysis data. Report can be exported as Portable Document Format (pdf) file or as image file using one of the many graphics formats.
A. Report pages
Views the report pages. Right click to copy page image to clip board.
B. Update button
When clicked forces update of all report data.
Right click to choose between automatic ( ) and manual update (
 ).
).
C. Magnifier button
Zooms view size of the report page images. Does not change image resolution.
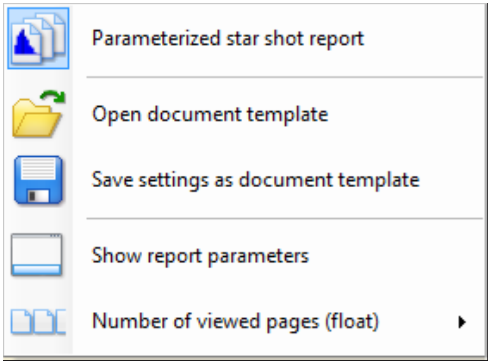
D. Report options button
E. Print button
Sends report to a printer. Printer selection dialog will appear.
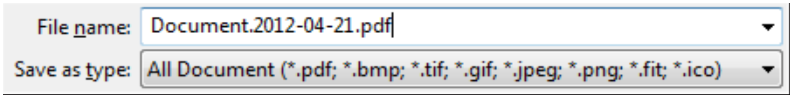
F. Save file button
Saves report to file. Select format type in the appearing dialog
G. Copy setting button
Copies current setting of all charts to the reporting tool.
H. Report items
Select data included in the report.