Passing Rate Optimization
The optimization tool allows to determine automatically the location that delivers the best agreement between treatment plan and dose measurement.
After selecting the ‘optimization’ tab just click the  to start the location optimization to maximize the passing rate. An example is shown below.
This button can also be used to stop the optimization process.
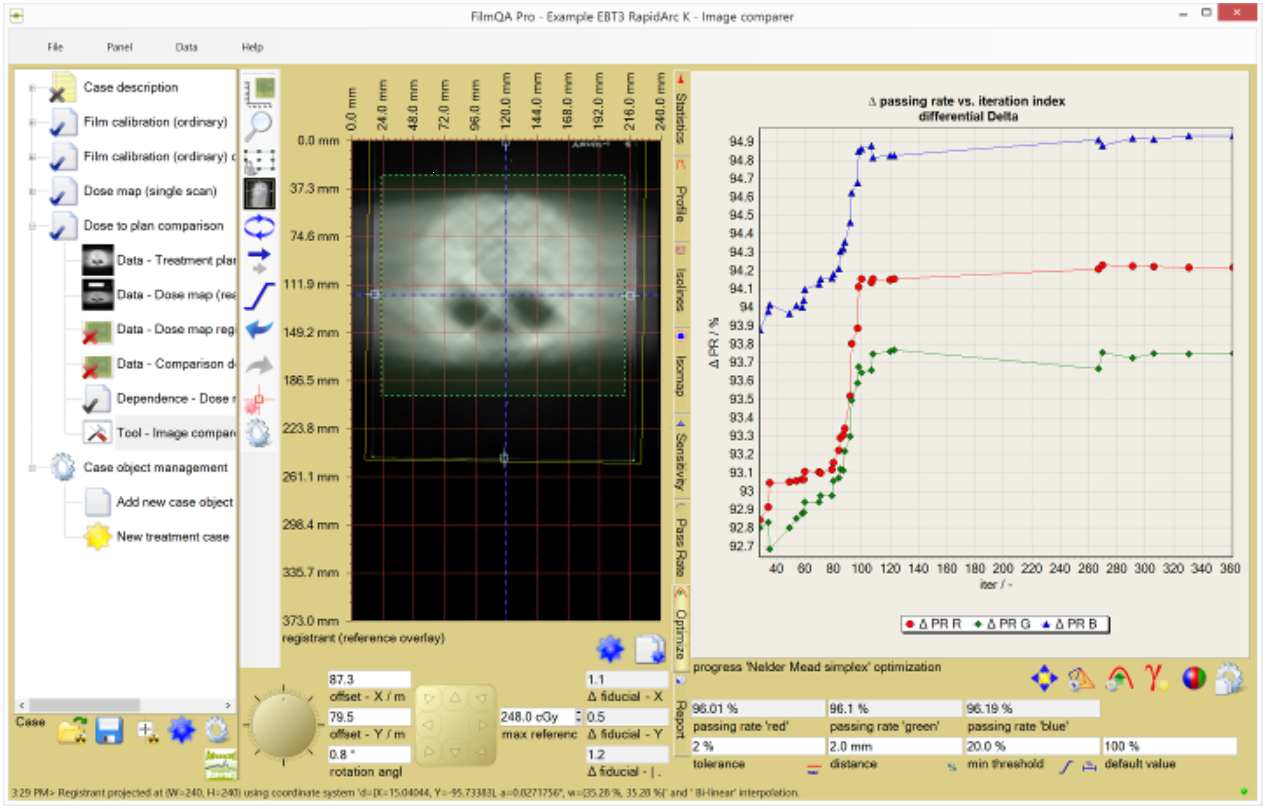
The default optimizer (Nelder Mead method) is a method capable to find global extremes if iterated long enough. There are options available to configure the search for the optimum position, use the  button to access:
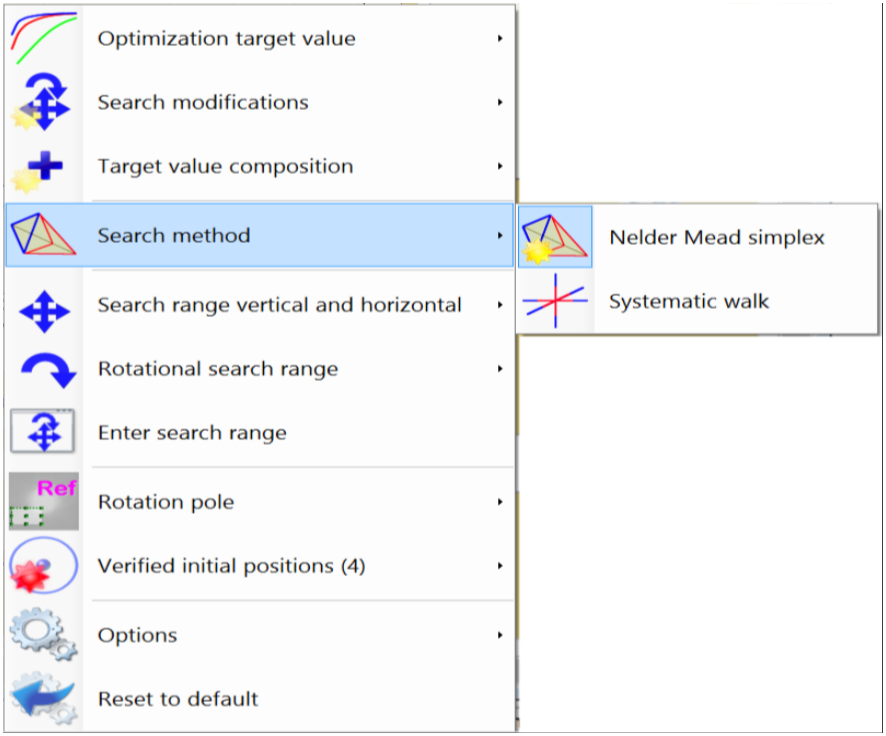
- Search method:
- Nelder Mead simplex: Nelder Mead simplex method is used to optimize position. Method stops when simplex diameter and local approximation error are below set limit or maximimum number of failed iterations is reached.
- Systematic walk: Systematic per component search based on trial and error. This method only finds closest local extreme, but it is very fast and self-stopping based on estimate of local approximation error.
- Optimization target value: Target value used to be optimize image position.
- Passing rate: Passing rate of comparison map is used as objective function. Although this is the intrinsic target for most tasks, only the points of the comparison map that are at the edge to fail or pass determine the iteration direction, i.e. the optimization is determined by local properties.
- Average: Average value of the comparison map is used as objective function. The average includes all pixel positions, i.e. the method is determined by global properties what might lead to better results (better geometric fit).
- Search modifications: Stipulates what and how image coordinates are used to find optimum position.
- Target value composition: Method to compound the color channel values. Ussing multiple color channels makes the optimization process more robust against local distortions and false local extremes are more rare.
- Search range: Allow coordinate modification range—intervals for x and y direction and rotation angle to find optimum position. Coordinates outside the range are penalized by contributions to the objective function.
- Rotation pole: Mode used to determine the pole to carry out image rotation. Any pole can be used, however, well placed rotation pole can speed up the search substantially.
- Verified initial positions: Standard positions test before the optimization is started with best of those tested initla positions. This prevents optimizer to start with very absurd image positions of the client image vs referenc image.
- Options: Rarely changed optimization parameters.
Charting options are available via button  :
:
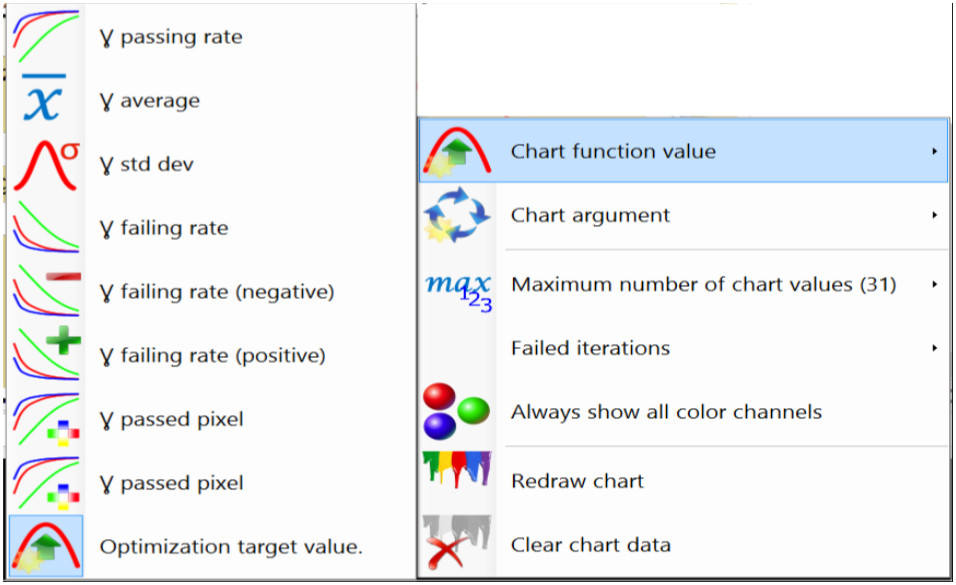
- Chart function value: Value used to chart progress of the optimization process.
- Passing rate: Ratio between number of pixels that passed the test criterion and total number of tested pixels.
- Average: Average of the comparison map values.
- Std dev: Standard deviation of the comparison map values.
- Failing rate: Ratio between number of pixels that failed the test criterion and total number of tested pixels. Failing rate = 100% - passing rate.
- Failing rate (negative): Ratio between number of failed pixels with value below the reference and total number of tested pixels.
- Failing rate (positive): Ratio between number of failed pixels with value above the reference and total number of tested pixels.
- Passed pixels: Number of pixels that passed the test criterion.
- Failed pixels: Number of pixels that failed the test criterion. Failed pixels = total number of tested pixels - passed pixels.
- Chart argument: The function value is plotted against this argument value.
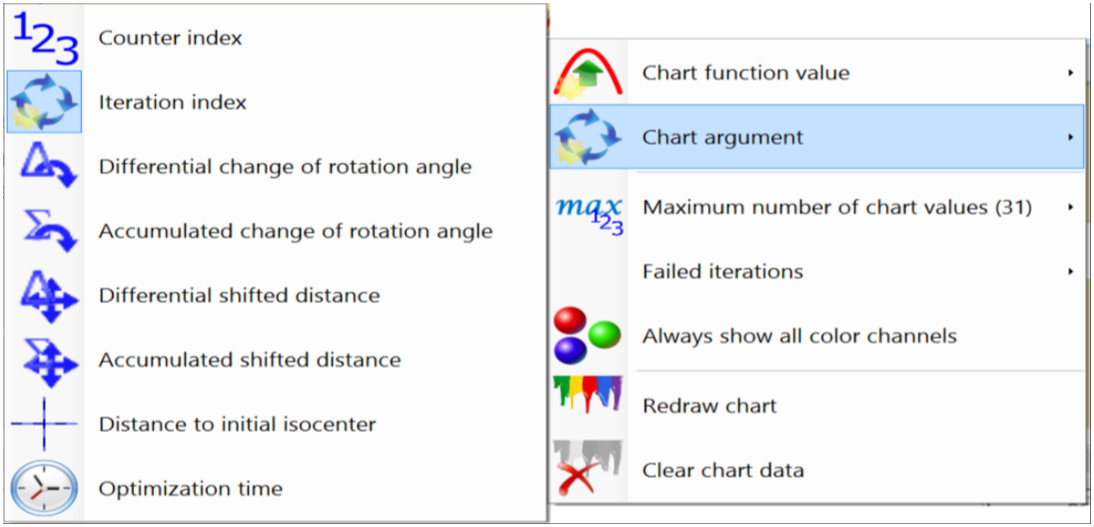
- Counter index: Counter index for all iterations is chart argument.
- Iteration index: Index of successful iteration is chart argument.
- Differential change of rotation angle: Change of rotation angle per iteration is chart argument.
- Accumulated change of rotation angle: Change of rotation angle since optimization start is chart argument.
- Differential shifted distance: Shifted distance per iteration is chart argument.
- Accumulated shifted distance: Shifted distance since optimization start is chart argument.
- Distance to initial isocenter: Distance of current and initial isocenterposition in client image is chart argument.
- Optimization time: Time since optimization start is chart argument.
- Maximum number of value: Maximum number of iteration values presented in the chart.
- Failed iteration: Options how data of failed iterations are displayed in the progress chart.
- Always show all color value: When selected, data for all three color channels are displayed independently from selection of color channels used for objective function.