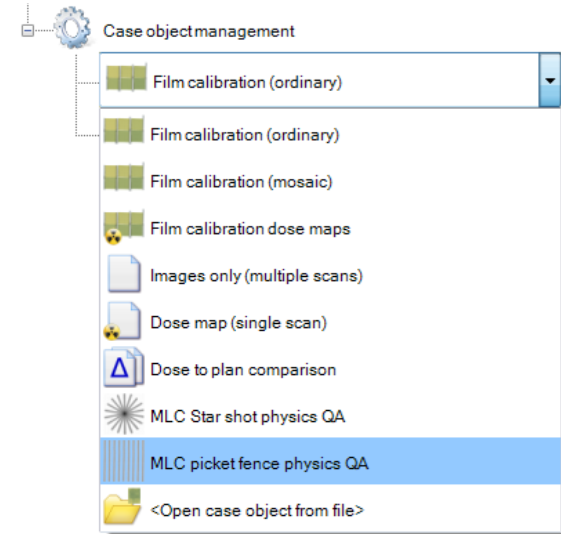
Add a ‘MLC picket fence physics QA’ object to your case.
Acquire the Picket Fence image - either read it from file or scan it directly.
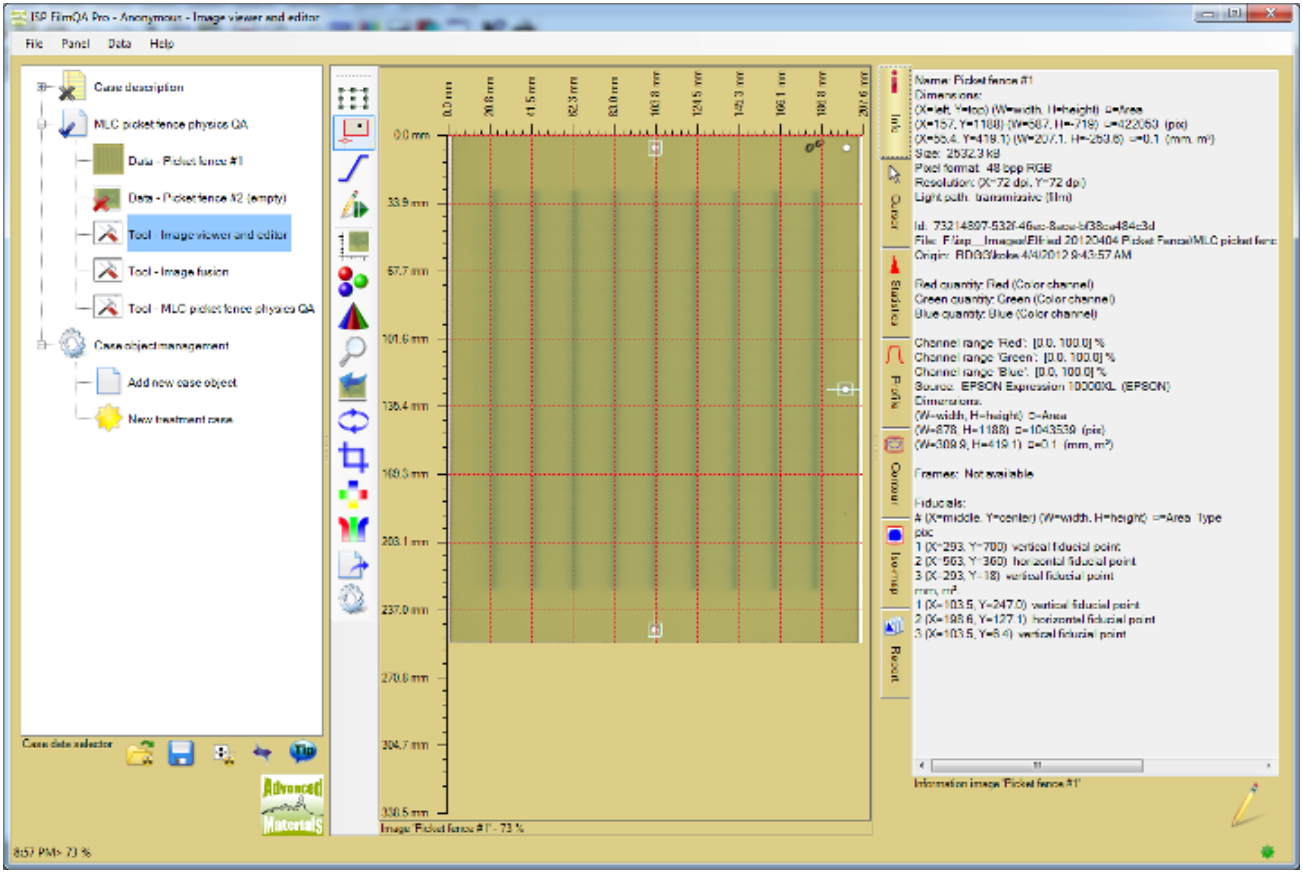
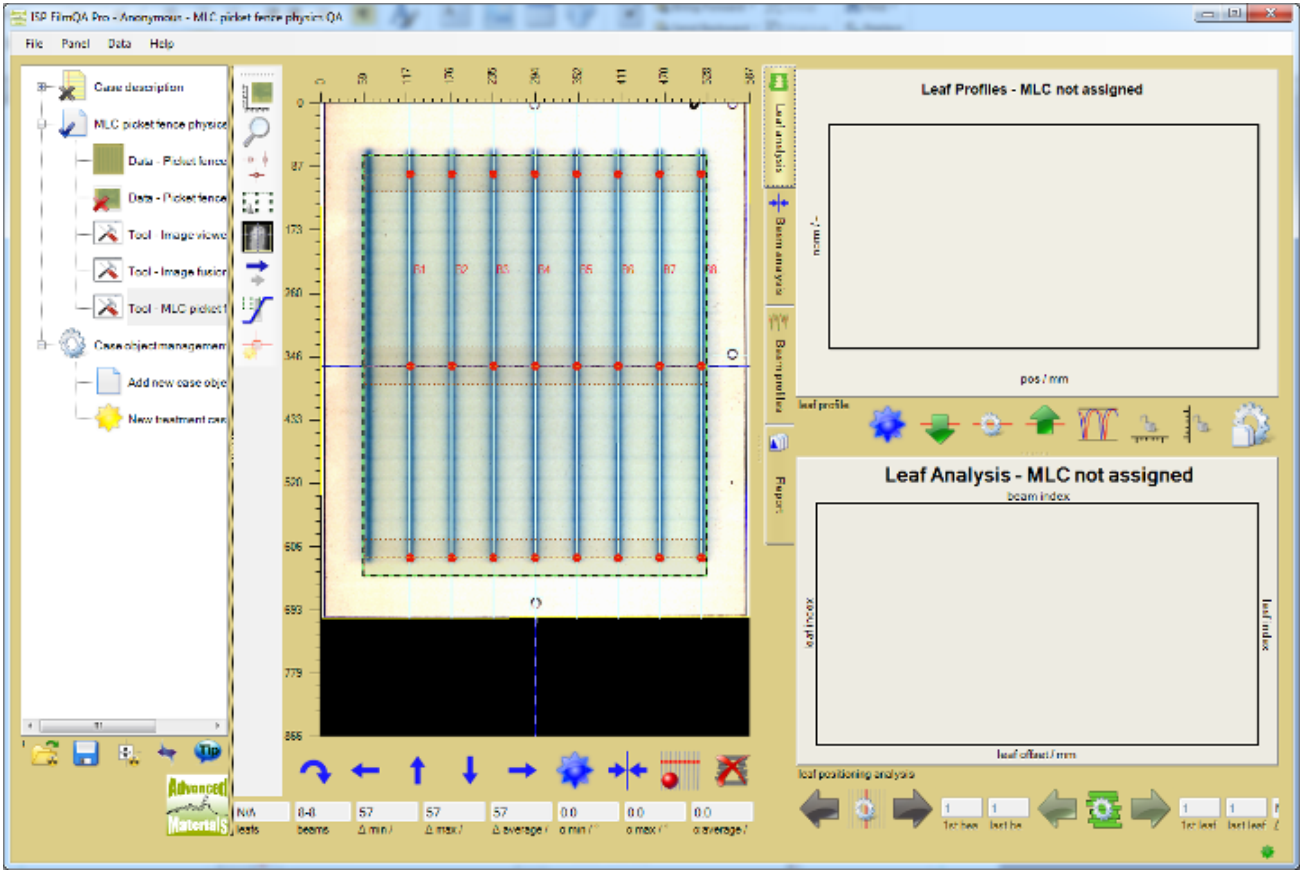
For automated image Registration select the fiducial tool  and mark the fiducial positions at the picket fence image as shown below. Any number of fiducials can be used to identify the isocenter. However, the minimum number to determine both x, y shift and rotation is 3 fiducials.
Tip: To move the fiducial marker , select it and either drag it with the mouse pointer or use Ctrl+Arrow keys. To delete a fiducial marker, select it and press Del key.
To change the fiducial type open the fiducial tool and select the wanted type.
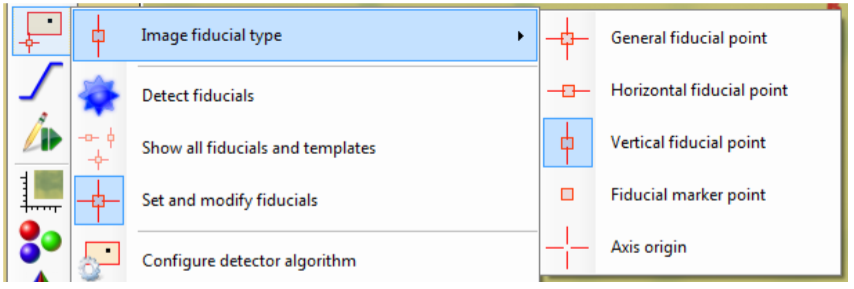
General fiducials are used to fit both a and y axis of the isocenter, Horizontal fiducials fit only the y coordinate.
When all fiducials are marked, select the tool “MLC picket fence physics QA” in the case tree.
The isocenter (blue/black dashed lines) is automatically fitted to the marked fiducials as shown below.
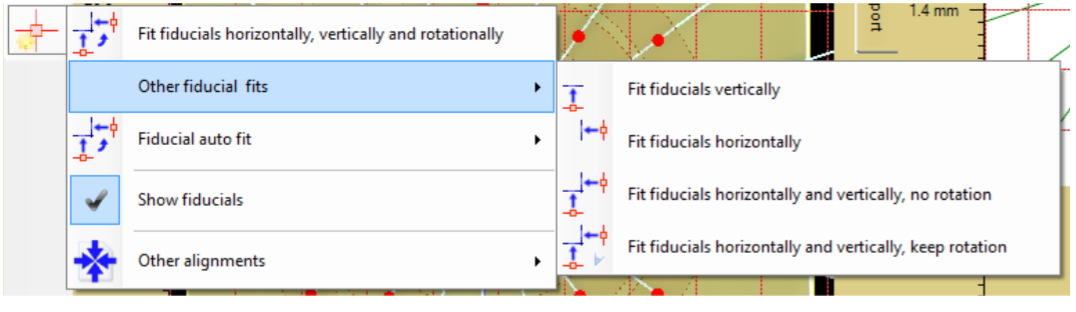
Tip: Isocenter can fitted with other options using the fiducial fitter tool  and selecting the wanted type of fit (see below).
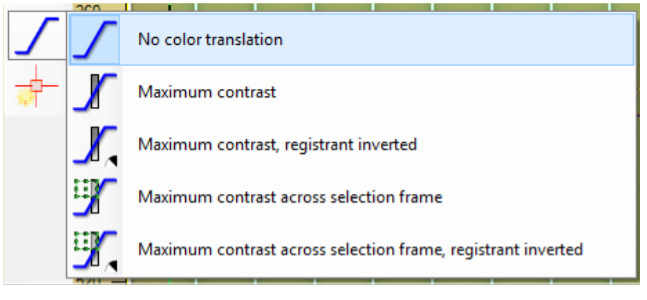
Tip: To make isocenter lines better visible turn off the maximum contrast color leveling as shown below.
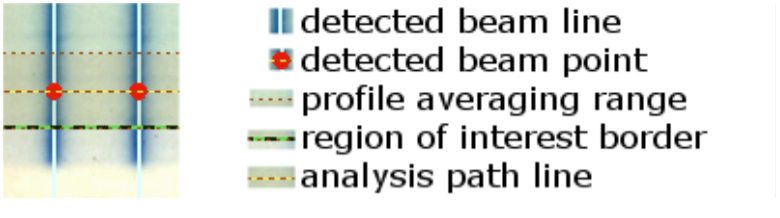
The picket fence analysis tools automatically detects the beam lines and displays the detected beam line points at the analysis path lines as shown below in the center section. The beam line detection uses the selected region of interest (green dashed rectangle) to analyze the image data. Select the  button to make this region of interest editable and click and drag the border lines so that only beam lines are covered as shown in the screen shot below.
The beam profile tab at the right shows the profiles along the selected analysis path lines and the detected extrema points.
The center section includes the following items:

The “Beam profile” tab at right shows the profile along the analysis path lines and the detected extrema. The  button allows to change the detection parameters. Default settings are optimized for the use of EBT3 films. Most important parameters are as follows.
Underneath the center registration image the beam line statistics is displayed including minimum, average and maximum distance of the detected beam lines as well as the minimum, average and maximum of the slant angle
Select the design of the MLC using the  buttons context menu as shown below:
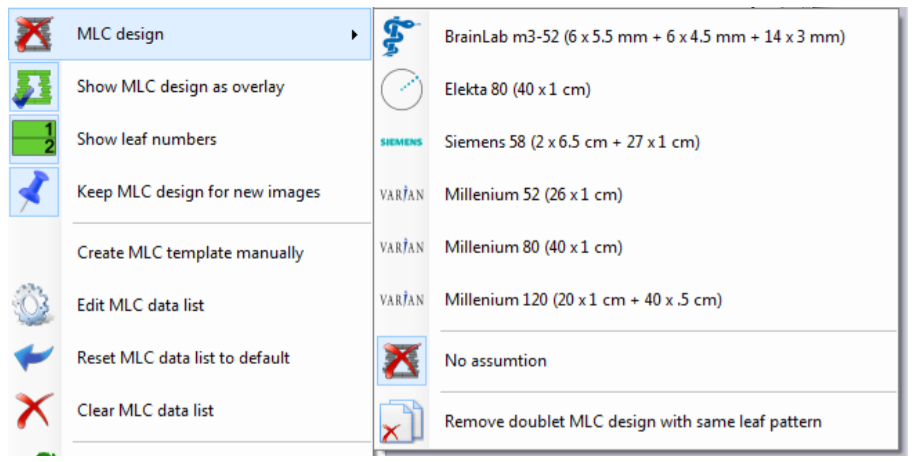
The example uses a Varian Millennium 80 MLC.
If the targeted MLC design is not available use “Create MLC template manually” to input new data.
When the MLC design is select it is displayed as overlay in the center section.
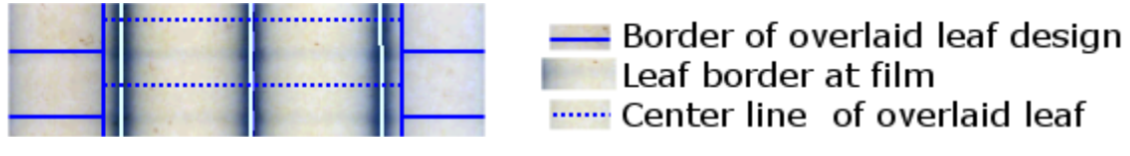
Use the  button to adjust the image position relative to the MLC so that leaf borders on the film line up with the overlaid MLC leaf borders (solid blue lines, dotted blue lines are leaf center lines)
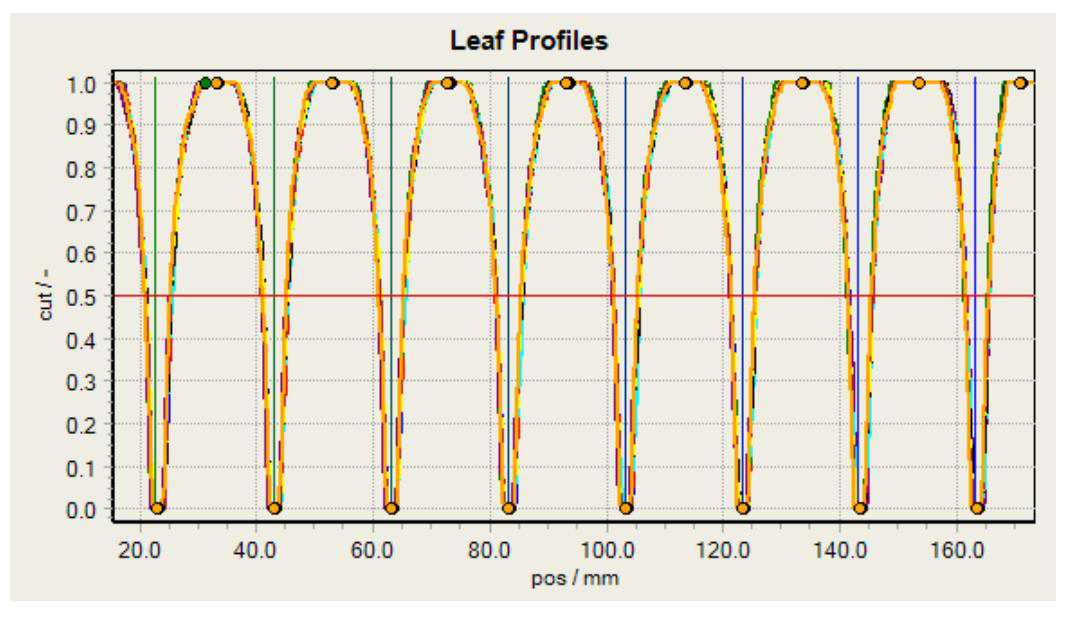
The space around the leaf center line is used the create profiles to detect the leaf openings as extrema. Select the “Leaf analysis” tab to commence the analysis.
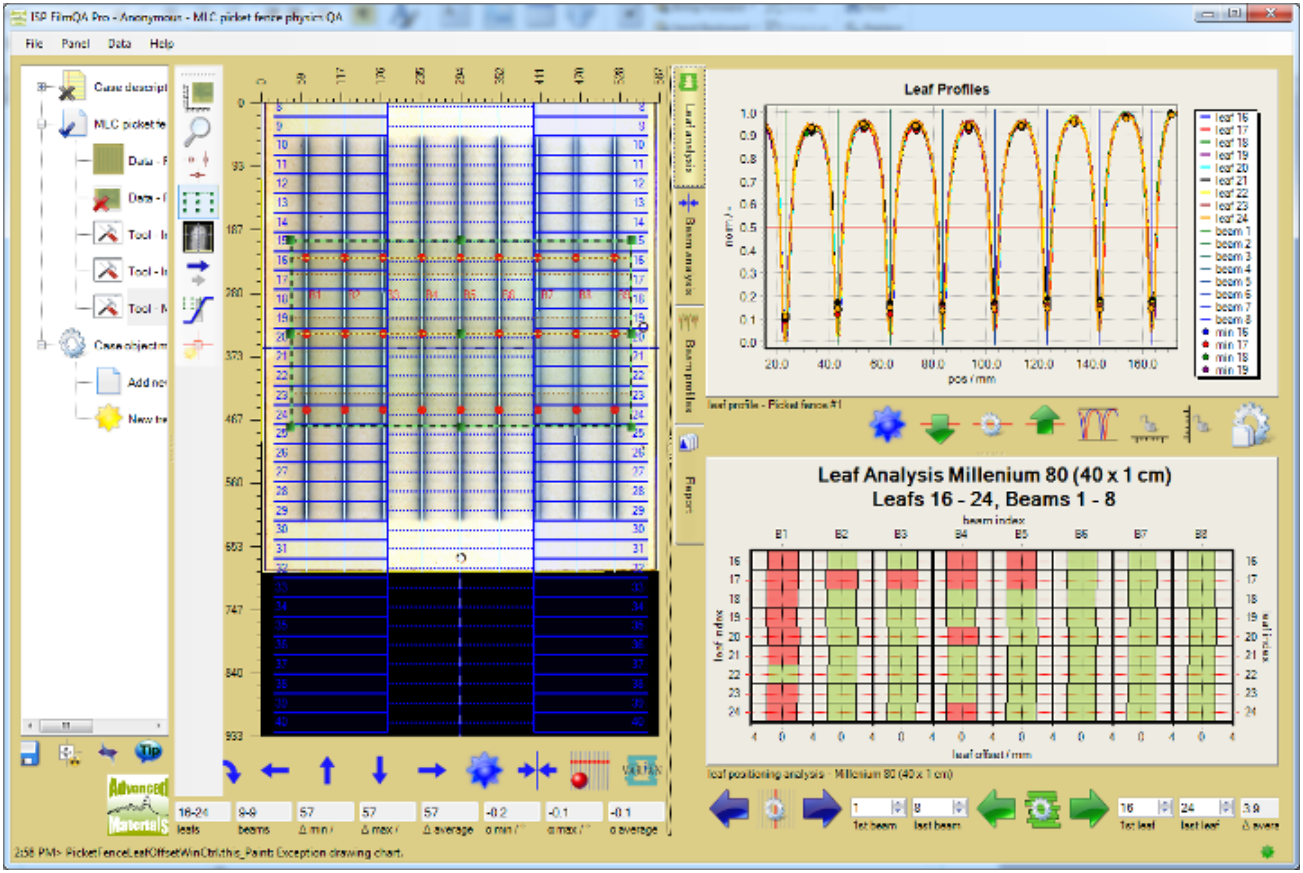
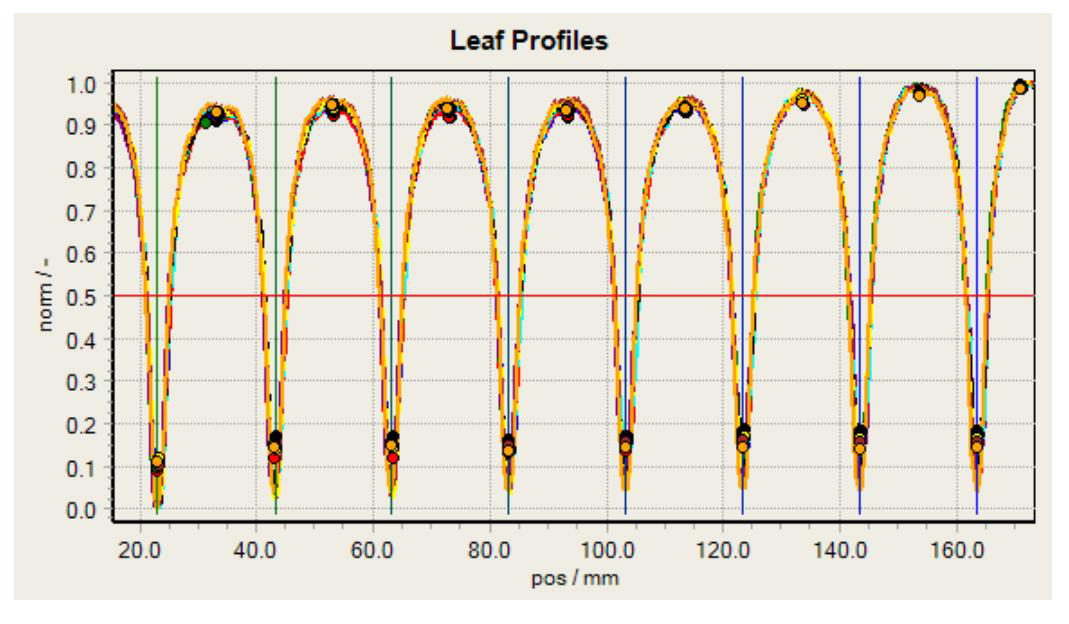
The upper part of the “Leaf analysis” tab show the profiles along the center lines for the selected leaf and beam ranges (bottom row). One can only select leafs located inside the region of interest selected in the center section (green dashed rectangle) and for detected beams (red number labels).
The leaf openings are determined as intersection of the profiles with a threshold value (red line in the upper chart). This detection threshold can be adjusted using buttons.  The profile values might vary due distortion of the measurement as well as due to the fact that the measurement actually determines dose equivalent value what can bias the shape of the scanned profile. To account for such deviations FilmQA Pro offers the following profile normalization options:
Normalize global minimum and maximum to 0 and 1: Global extrema for each leaf center profile are normalized to 0 and 1 to account for (small) drifts across the image.
Equalize all local minima and maxima to 0 and 1: Normalization changes for each beam and leaf extrema pair and equalizes all profile sections, all maxima are at 1 and all minima are at 0.
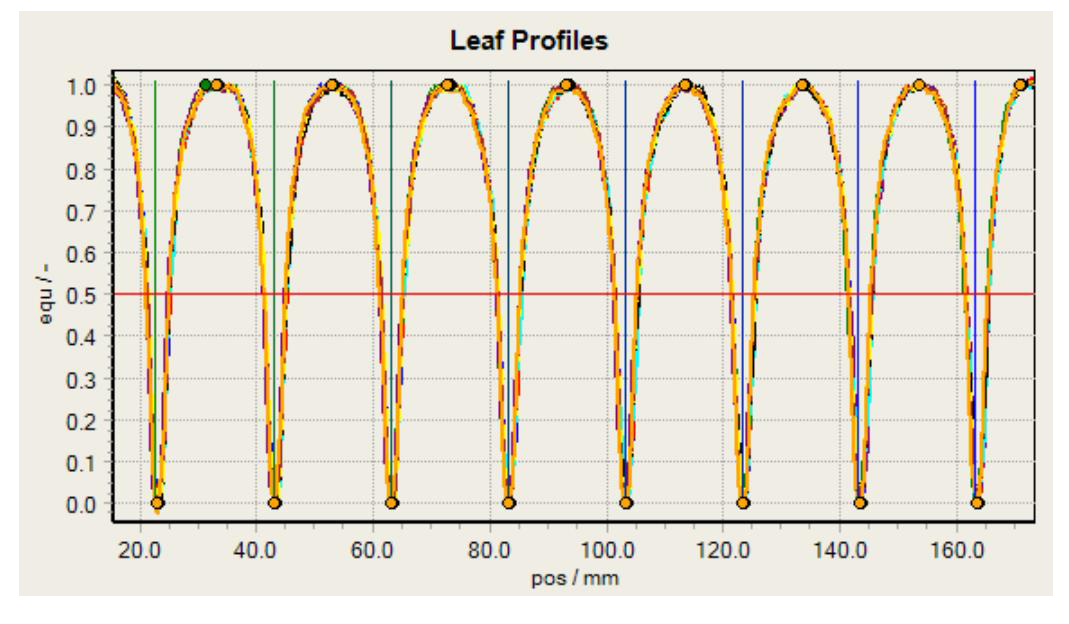
Truncate at smallest local minimum and maximum values and normalize to 0 and 1: Truncate lower part of the profile at highest minimum and upper part of the profile at lowest maximum and normalized resulting profile to 0 and 1. This approach is very advantages when the leaf openings vary over a wide range, i.e. the dose vary a lot between the leaf openings.
Use the  button to select the normalization mode for the profiles.
Relative analyzed leaf width range (%): Width of the averaging region around leaf center relative to leaf width used to generate the profile.
When ever the profile data or analysis method is changed, FilmQA Pro calculates the leaf opening width values for the selected beam and leaf index range as shown below.
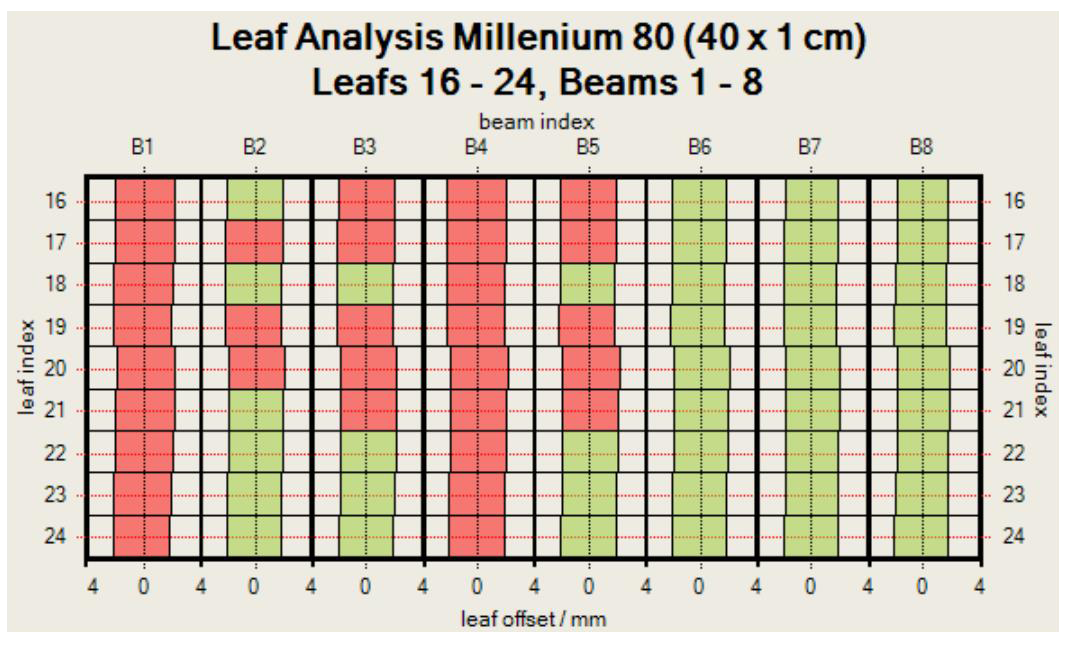
The color of the depicted opening depends on width and bias of the specific leaf opening. Threshold value at which the color changes can be assigned using the context menu of the chart (right click chart).
When the analysis is completed, select the report tab to summarize the results for the records.
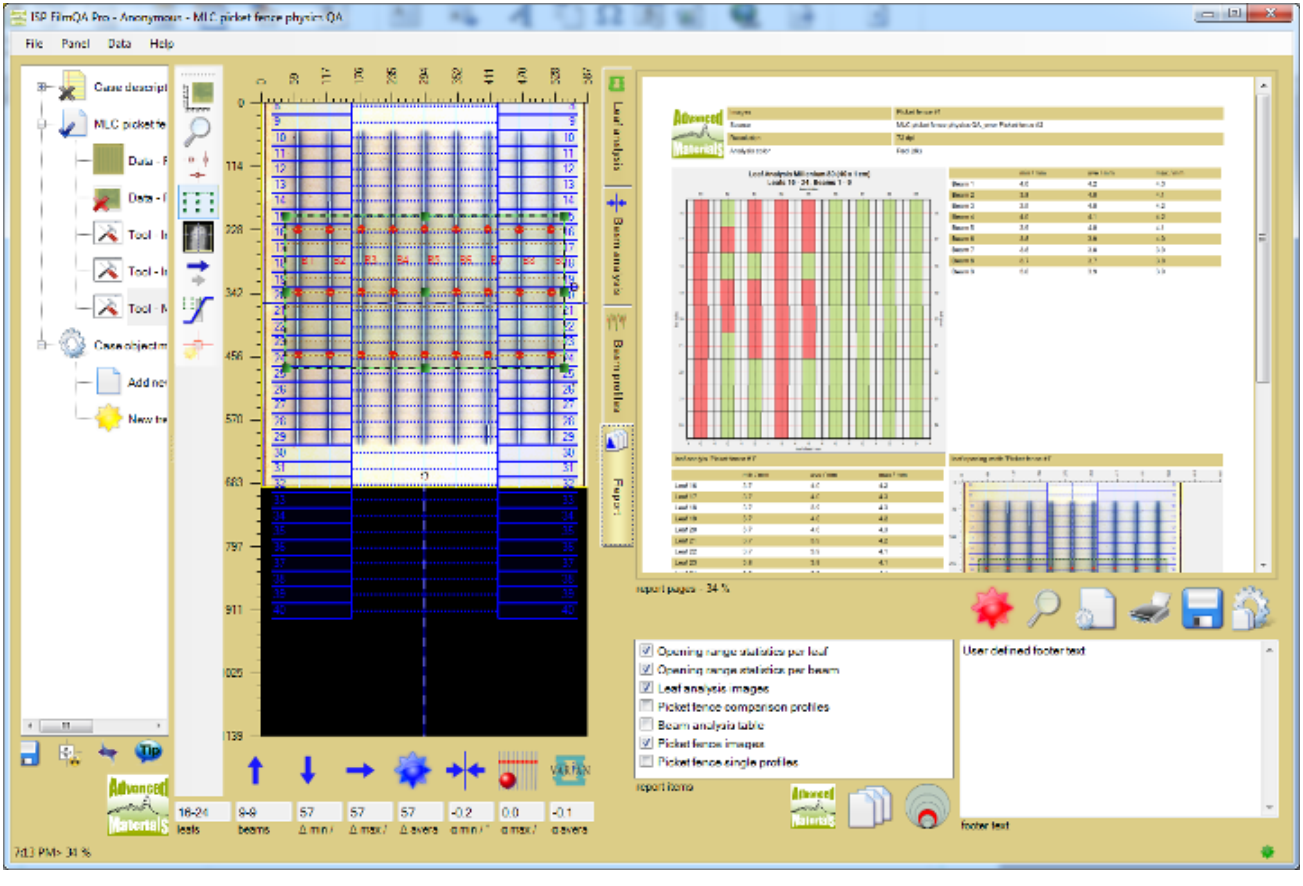
Enable the items that should be included in the report and add the information to identify the test in the ‘footer text’ box. Use  button to save the report as file (e.g. pdf file).