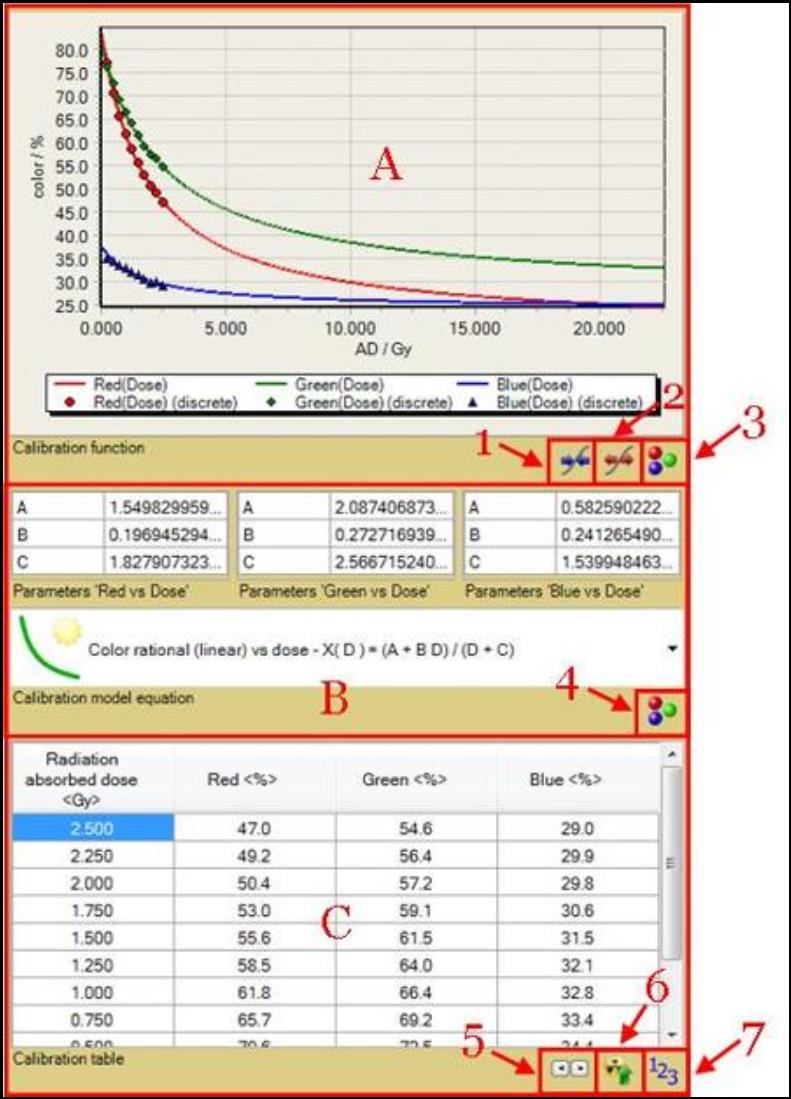
The Calibration Tool Panel displays the calibration data, fitting function and coefficients. The panel can be accessed under “Panel” in “Menu” or “Film calibration” in “Case Data Selector.” It allows you to create calibration file based on the user-defined section of the calibration images.
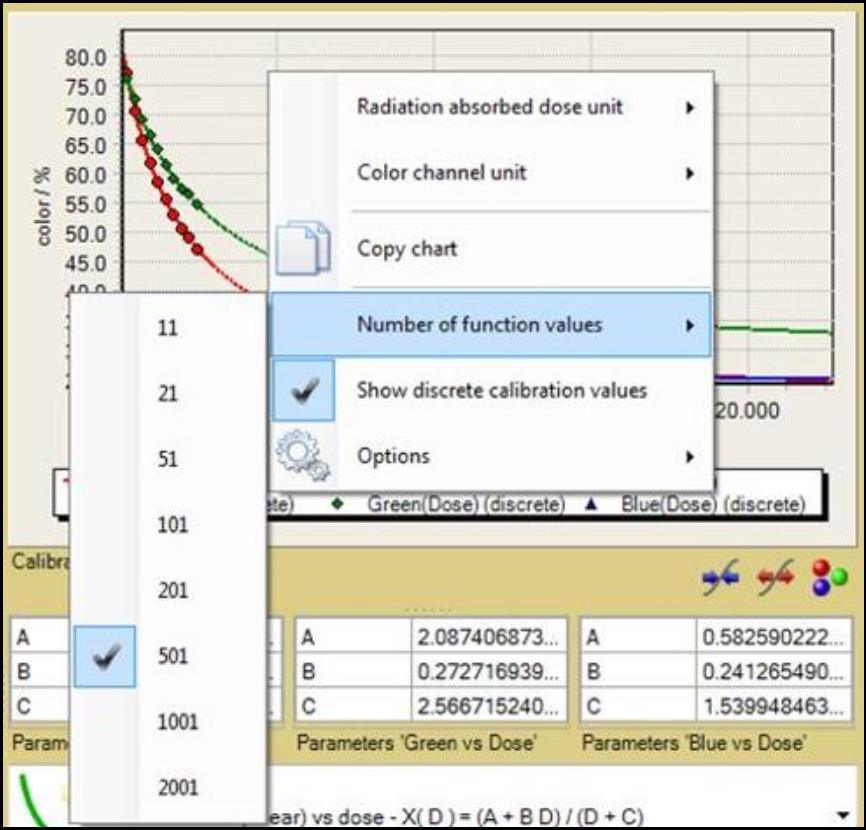
A. The “Calibration Function” chart displays a calibration plot of “color value vs. absorbed dose” for each color channel. There must be enough data points in the “Calibration Table,” C, to fit to a selected calibration function and display the plot.
1. The “Data Range Minimization” button allows you to reduce the range of the axes in the calibration chart to the discrete range of the calibration data, i.e. minimum validity range of the calibration.
2. The “Data Range Maximization” button allows you to extend the range of the axes in the calibration chart to the full color interval and corresponding dose range, i.e. the maximum utilization range of the calibration.
3. The “Calibration Color Channel” icon allows you to change the color channels displayed in the calibration chart. The selection does not affect the calibration. It only changes how calibration functions are displayed.
B. The “Calibration Model Equation” drop-down list allows you to choose the equation used to correlate the calibration data.
4.The “Equation Parameters” icon allows you to select whether calibration function parameters of the color channels are shown. The icon appears as  when parameters are hidden.
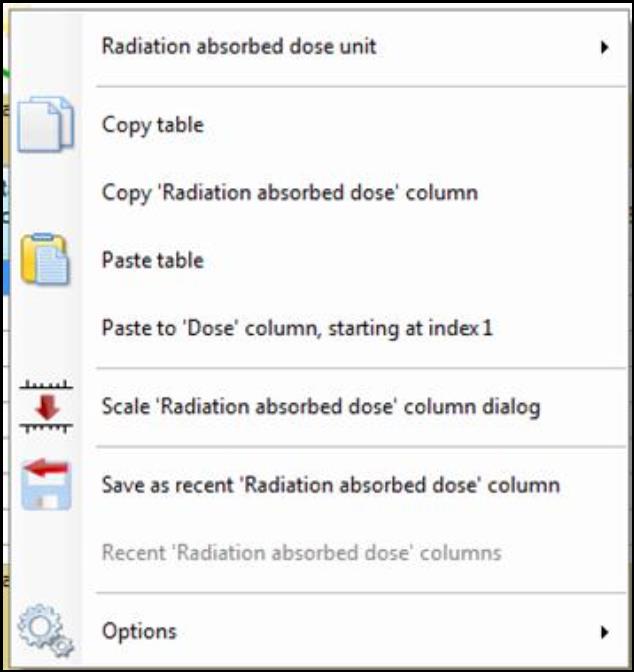
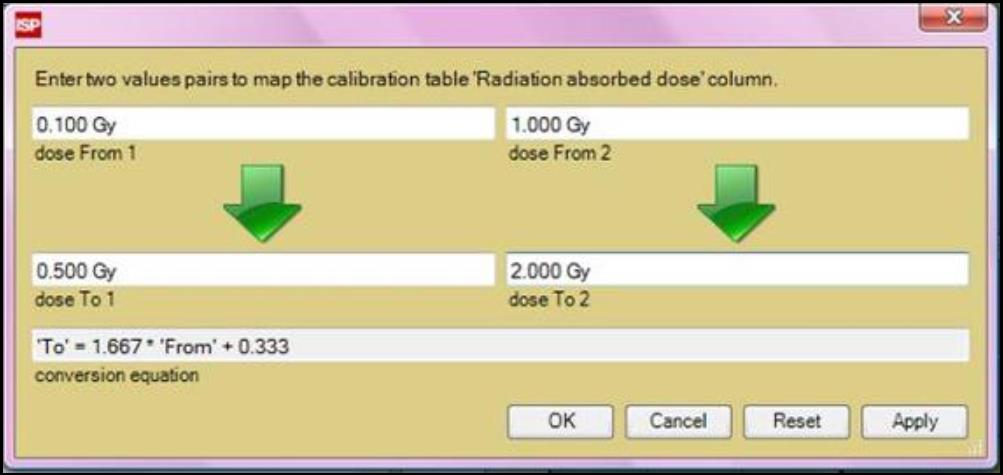
C. The “Calibration Table” allows you to view and enter the data points associated with the calibration patches.
5. The “Number Format Buttons” feature allows you to change the format of the number displayed in the table.
6. The “Synchronize” button allows you to synchronize color channel values with radiation absorbed dose values. It reassigns calibration table so that the radiation absorbed dose values and selected channel values are sorted ascendingly. Click on the button to select the color channel preferred to synchronize. Synchronization works only when “Auto Copy,” 7, is on
7. The “Auto Copy” button allows you to copy color channel values from the image selection in “Image Panel.” The color values across each selection frame is averaged and copied to the calibration table. The icon appears as  when the auto copy feature is on.