Data Panel
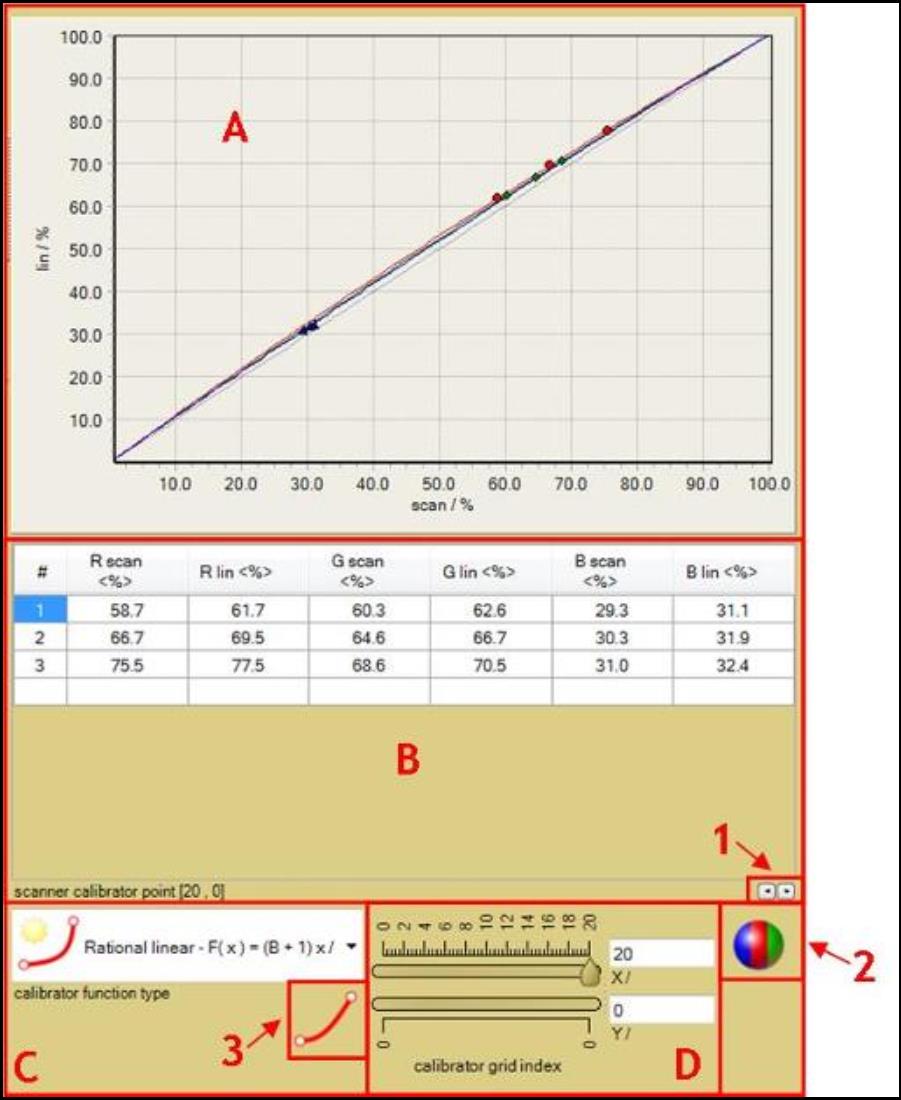
The Data Panel displays the extracted data points over the selected scanner grid. The panel allows you to select the appropriate calibrator function to fit for scanner linearity correction.
- The “Linearized Color Value vs. Scanned Color Value ” chart displays the scanner characterizing function, which is described in the “Scanner Linearization Panel” section as S(x, y, Xscan(x,y)). The function is used to correct for the scanner lateral effect. The ideal curve will have a slope equal to one where the scanned data is equal to the ideal linearity.
- To zoom in, click and drag a region from top left to bottom right of the preferred region. To unzoom, click and drag from bottom right to top left.
- Right click and drag to move the line chart to another location.
- The “scanner calibrator point” table displays the extracted data points over the selected scanner grid region which can be chosen under “calibrator grid index” sliding bar, D. These data points include the scanned color values at the selected scanner grid and the reference color values at the selected scanner grid.
- The information for number of points extracted can be viewed under “Status Bar.”
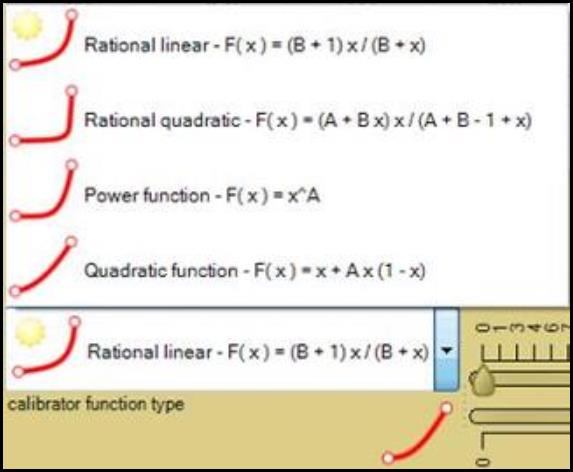
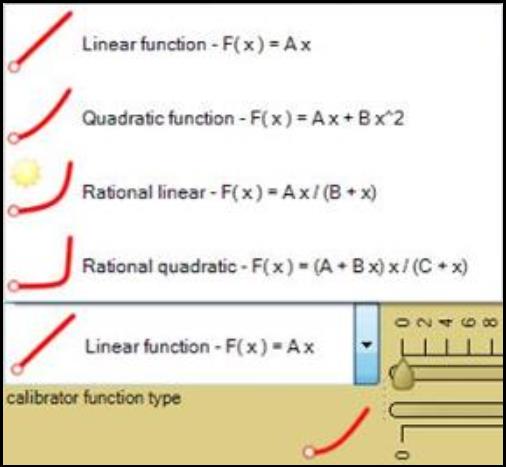
- The “calibrator function type” drop-down list allows you to choose from different model equations to correlate the calibration data. The function is used to preselect base behavior of color calibration including forced calibration points selected in button 3.
- There are eight different model equations depending on the forced calibration points selected under button 3. A, B, and C are the parameters used to fit the functions. Less parameters give a more stable behavior while more parameters provide more flexibility to adapt to data. Choose the most appropriate model function to approximate the correction curve, S.
- The “calibrator grid index” sliding bars allow you to choose the calibrator index in both x (sensor alignment) and y (scan directions) directions. The total number of indices depends on the number of calibrators chosen in the “Regions Panel.”
- The two text windows on the right allow you to manually enter the calibrator location where you want to extract the data from.
- The “Number Format Buttons” feature allows you to change the format of the number displayed in the “scanner calibrator point” table, B.
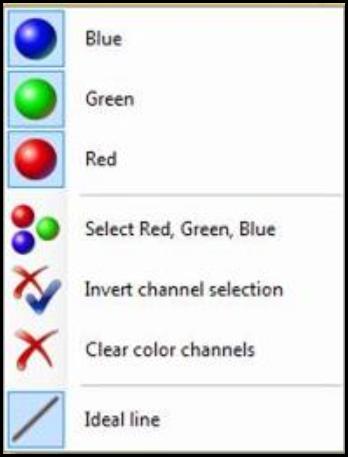
- The “color channels” button allows you to select the color channels of the calibration data displayed in the “Linearized Color Value vs. Scanned Color Value ” chart, A. Click or unclick the preferred color channels to view or hide them on the chart.
- Select “Ideal line” to view the perfect scanner characterizing function S on the chart where S = 1.
- The “Forced color calibration points” button allows you to force the calibration curve to include black (0,0) and white (1,1). Scanner internal calibration is at least done for minimum (black) and maximum (white) signal. Black (no signal) is usually correct while white calibration can be influenced by scanned media. The calibration curve in the “Linearity vs. Scan” chart, A can be forced to include black (0,0) and white (1,1) or black only. The icon appears as
 when both black and white are forced included into the calibration curve. The button becomes
  when only black is included.