Regions Panel
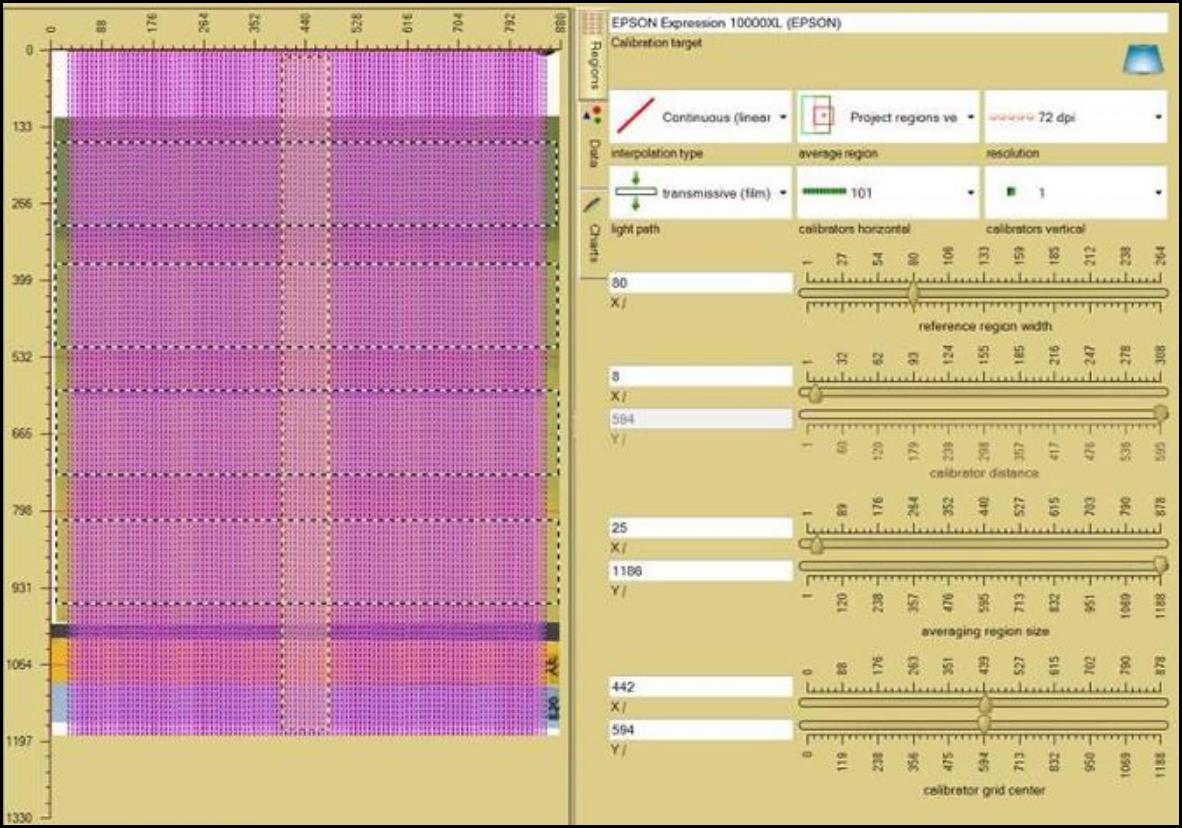
The Region Panel allows you to define the regions used to approximate the scanner characteristic function S described in the “Scanner Linearization Panel” section.
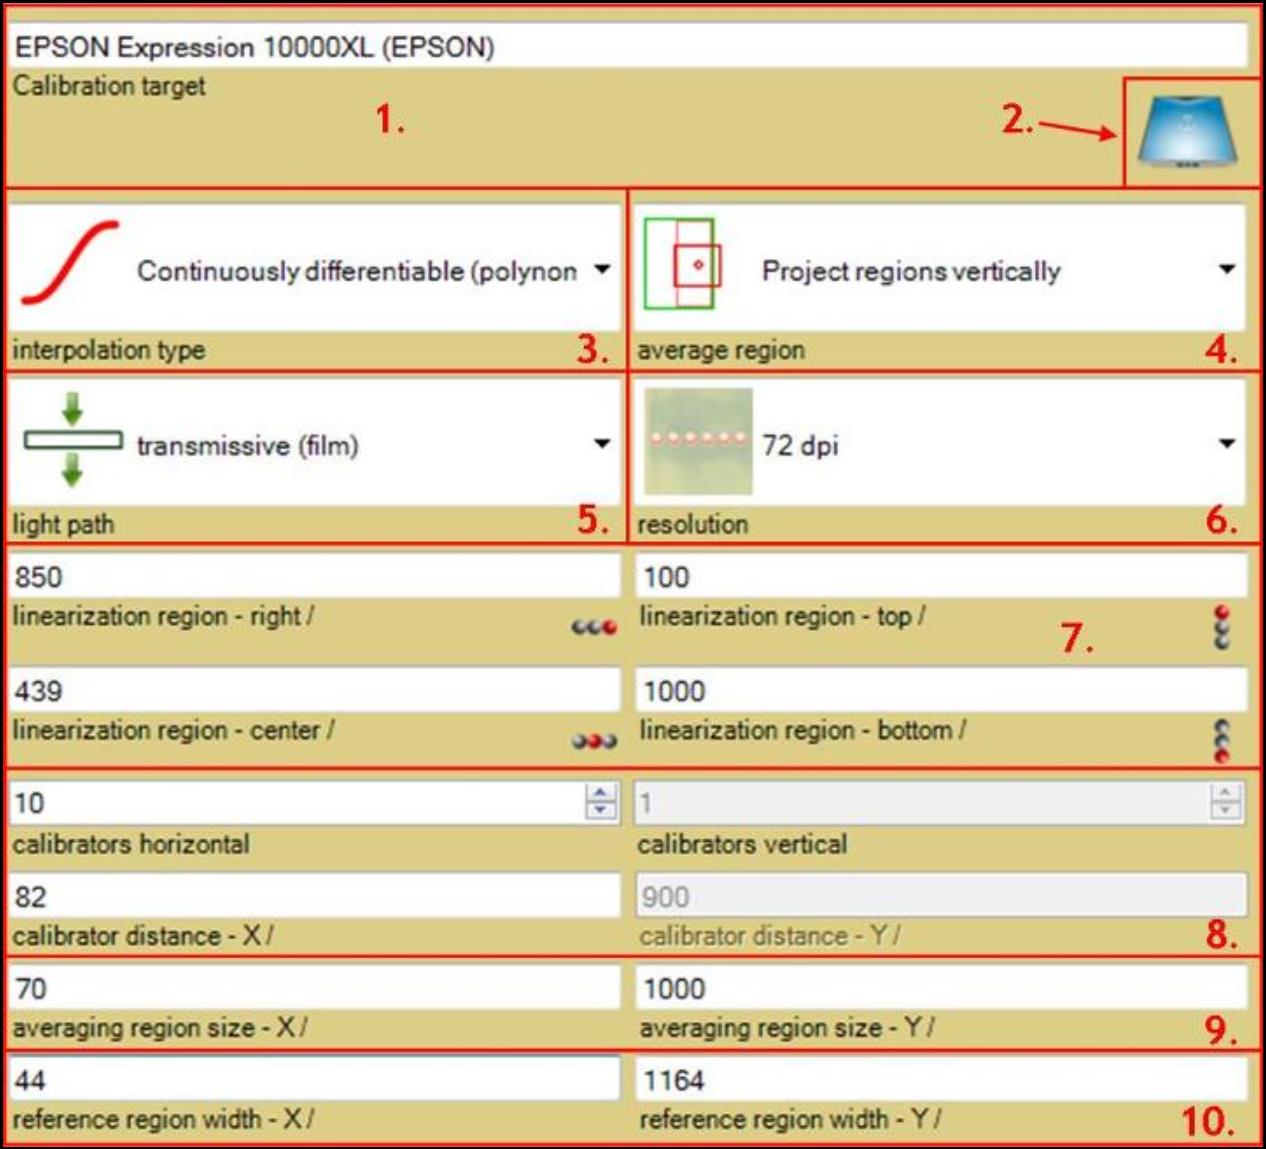
- The “Calibration target” window shows the model and manufacturer name of the scanner being calibrated.
- Click on the “Scanner data” button to open the “Scanner Data Window.” It allows you to enter scanner information and create scanner lists.
- The “interpolation type” drop-down list allows you to choose from three different functions, i.e., linear, cubic, and polynomial, to interpolate pixel calibration between calibrators.
- For pixels without calibrators, proximal interpolation is used, i.e., the four nearest neighbors with calibrator are interpolated.
- The “average region” drop-down list allows you to select the mode used when calibrator’s average region (pink area shown in the “Image Panel”) is not fully included in image’s frame (dotted gray-black area). It determines how the average regions are projected inside the frame created in the image.
- You need to have at last one frame inside an image. By default this is the entire image frame, which makes no difference when having a full scan.
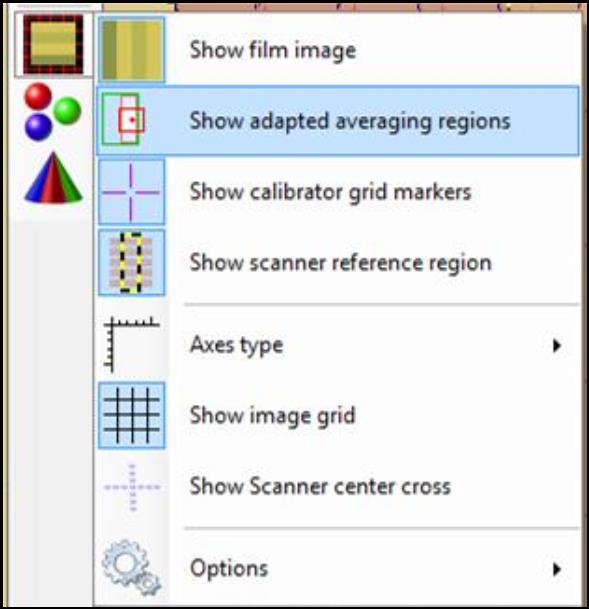
- To see the effect of the “average region,” click on the “scanner linearization” button in the “Image Panel” and select “Show adapted averaging regions.”
- Move the frames around and see the resulting (adapted) regions in real time.
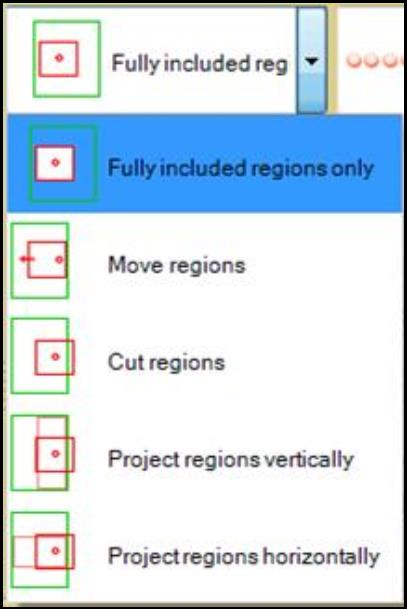
- There are five average region modes:
- “Fully included regions only” shows only the average regions that’s fully included inside the frame.
- When “Move regions” is selected, the average regions are moved into the bitmap frame when grid point is inside the bitmap frame. It keeps the area constant using this mode.
- “Cut regions” cuts the region to point that are both in average region and bitmap frame.
- “Project regions vertically” uses x range of average region and y range of bitmap frame.
- “Project regions horizontally” uses y range of average region and x range of bitmap frame
- The “light path” drop-down list allows you to assign the light path used to calibrate the scanner.
- Images not scanned with this application do not include the light path information.
- If “undefined” is selected, the light path information is ignored.
- The “resolution” drop-down list allows you to set the scanner resolution used to calibrate the scanner linearization.
- The value of resolution is automatically determined from first valid scanned image. Images with a different resolution are ignored.
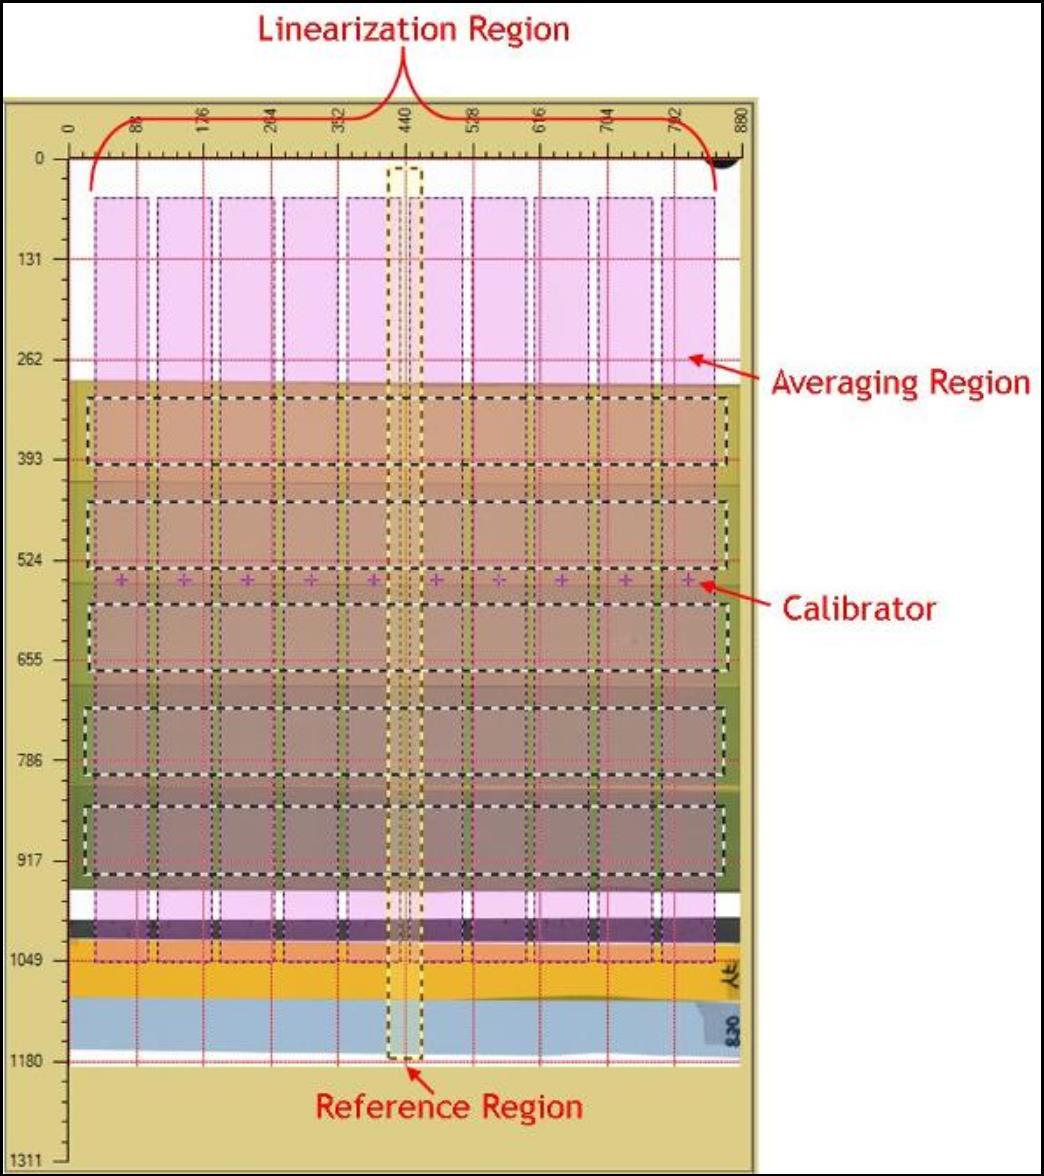
- The “linearization region” text windows allow you to change the ending position of linearization region. As shown in the image above, the linearization region is constituted of all the averaging region.
- Click on
 to change the text windows between left, center, right, and width to change the location of left ending point, center location (in x direction), right ending point, and the length of width for the linearization region.
- Click on
 to change the text windows between top, middle, bottom, and height to change the location of top ending point, middle location (in y direction), bottom ending point, and the length of height for the linearization region.
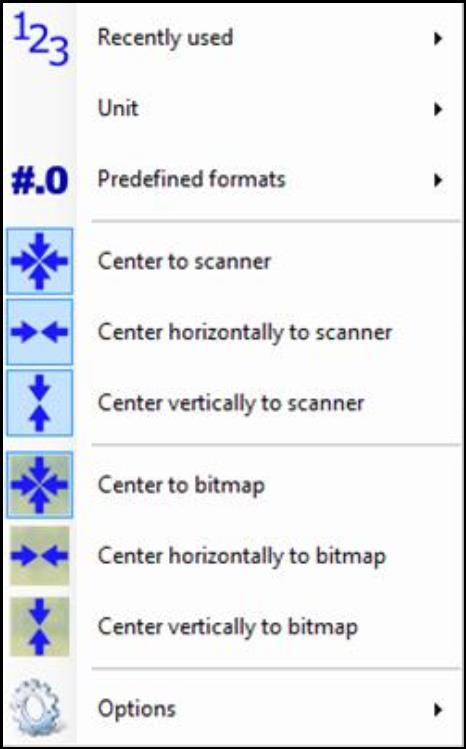
- Right click inside the text windows to center the linearization region to the scanner or bitmap center.
- The “calibrator” text windows allow you to change the number of calibrators (the pink cross in the “Image Pane”) in horizontal as well as the distance between them. The scanner linearization is limited to 1 calibrator in y direction, i.e., “calibrators vertical” and its dependent parameter “calibrator distance - Y” are read only.
- The “averaging region size” text windows allow you to change the width (X) and length (Y) of the averaging region (pink area in the “Image Panel”). The averaging regions are used to calculate the averaged scan result at the calibrator points.
- The “reference region width” text windows allow you to change the width (X) and length (Y) of the scanner reference region located at the vertical center of the scan area (the dotted yellow-black area in the “Image Pane”). The scanner reference region represents the scanner sweet spot where the location dependence of the scanner is at its minimum. The average value over reference region is considered correct color value with respect to lateral (sensor) direction. The region is selected as rectangle area symmetric to the scanner center in x direction.
Note: Varying the settings for the calibrator grid, it is found that a finer grid with overlapping averaging regions delivers good approximations of the scanner characterization function.