Profile Panel
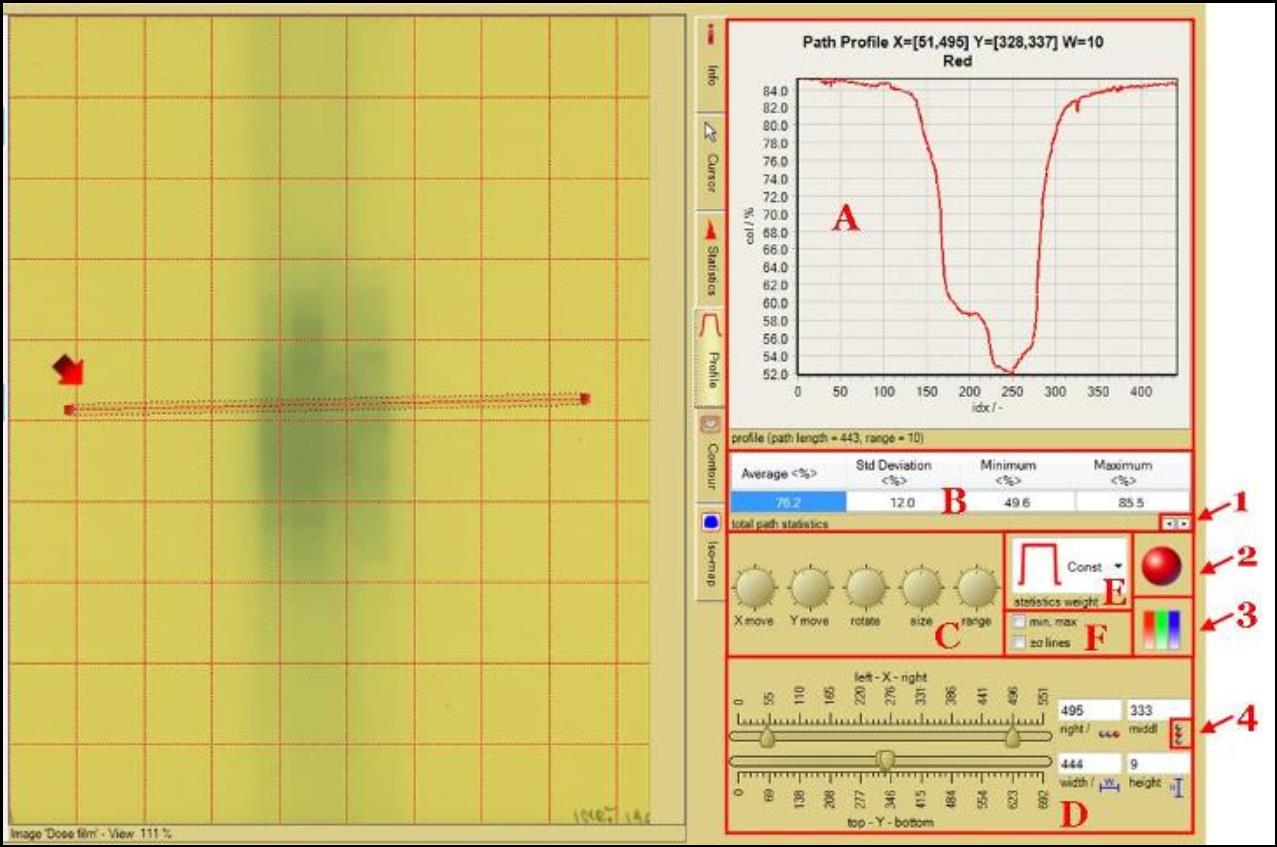
The Profile Panel is one of the sub-panels of “Film Evaluation Panel.” Click on the forth tab to access the “Profile Panel.” It allows you to draw image path on the “Image Panel” to display statistics (as indicated by the red arrow). Click and drag on the “Image Panel” to create an image path.
- “Path Profile” shows the line graph for dose or color channel vs. location of the path for the image opened in the “Image Panel.”
- Under “Case Data Selector," double click on “Dose map from image (single scan)” and select
- “Data – Dose film” to see the path profile for color channel value vs. path location.
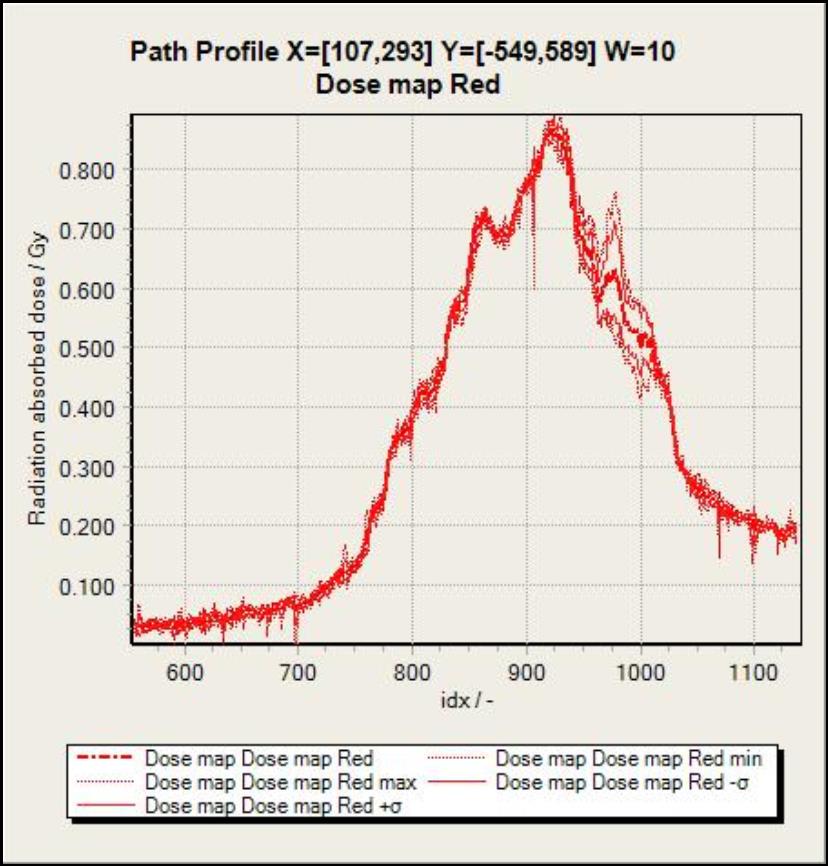
- “Data – Dose map (read only)” to view the path profile for dose vs. path location.
- Click on the image path and drag around to see the real time tracking of path profile.
- To zoom in, click and drag a region from top left to bottom right of the preferred region. To unzoom, click and drag from bottom right to top left.
- Right click and drag to move the line graph to another location.
- Right click inside the graph to change the units or the configuration of the graph and to copy chart.
- “Total path statistics” table displays the pixel information of the image path.
- Click on the image path and drag around to see the real time tracking of pixel information.
- Under “Case Data Selector," double click on “Dose map from image (single scan)” and select
- “Data – Dose film” to see the minimum, maximum, and standard deviation of the color channel value for the path created.
- “Data – Dose map (read only)” to view the minimum, maximum, and standard deviation of dose information for the path created.
·
- Right click inside the panel to change the units and the configuration of the table.
- The wheel buttons change the size, range, and location of the image path. Click on the buttons and drag in circle motion to change. Right click on the buttons to change in a predefined value.
- The two sliding bars in box D allow you to change the ending location of image path in x and y directions. The four windows on the right hand side allow you to enter the center and ending locations of image path in x and y directions as well as the width and height for the path.
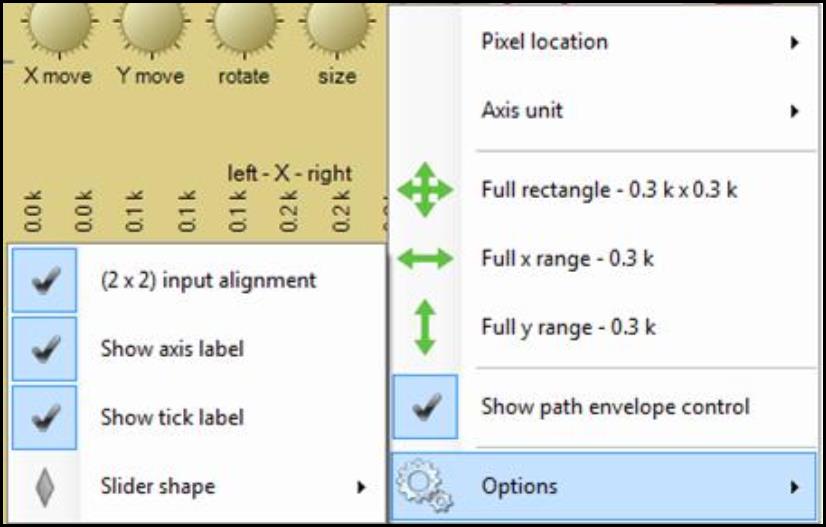
- Right click on the button bellow the four windows, 4, to change the windows between left, center, right, top, middle, and bottom.
·
- Right click inside box D to change the unit, configuration, and range of sliding bars and four windows.
- Select “Full rectangle – 0.3k x 0.3 k” to create a image path which goes across the entire image diagonally.
- Uncheck “Show path envelope control” to hide box D.
- The “Statistics weight” drop-down list allows you to choose a weight function used to give pixel values an individual weighting depending on the distance of a pixel position with respect to the image path.
- The check boxes allow you to show minimum, maximum, or standard deviation of the image path in the “Path Profile,” A.
- The “Number Format Buttons” feature allows you to change the format of the number displayed in the window.
- “Profile Color channels” button allows you to select the color channels to calculate the profile statistics data. Click on the button and
- Check “Show pixel values” to enable the selection of other color channels and the display of color channel histogram when “Data – Dose map (read only)” is selected under “Case Data Selector,"
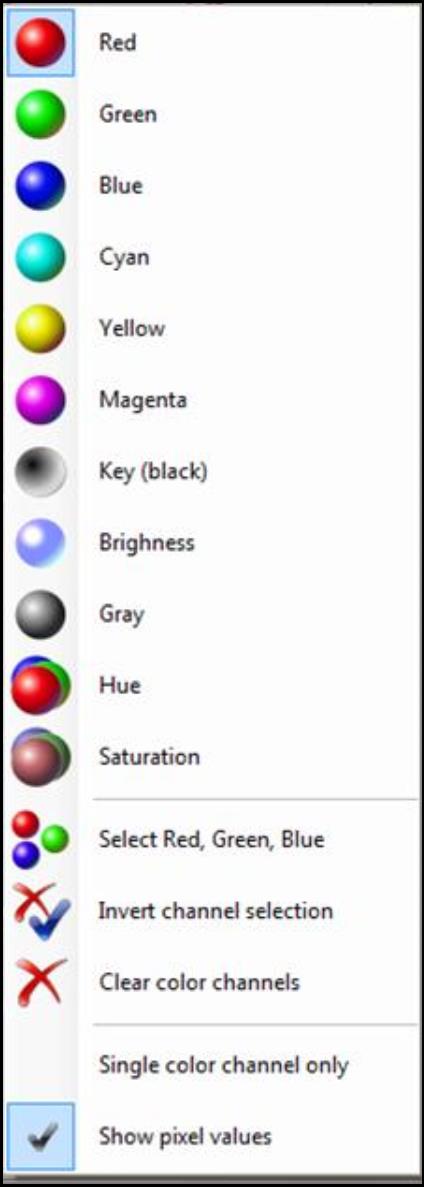
- Check “Single color channel only” to enable the selection of only one color channel, i.e., with a new selection all other channels are deselected.
- “Profile color translation matrix” allows you to select a color matrix or color translation that is applied to the pixel values (color) before the profile statistics data are calculated. Click on the icon and
- Select “Color channel ratios” to divide all profile color channel values by color selected.
- Select “Invert” to invert color channel values for creating image negative effect.
- Select “Manage color translation matrices” to open the “Bitmap Color Translation Editor.”
- Select “Manage color translation maps” to open the “Color Translation Maps Editor.”
- Check “Apply color translation to mapped images” enables mapping to image that has been mapped, e.g., dose map of a dose map.