Statistics Panel
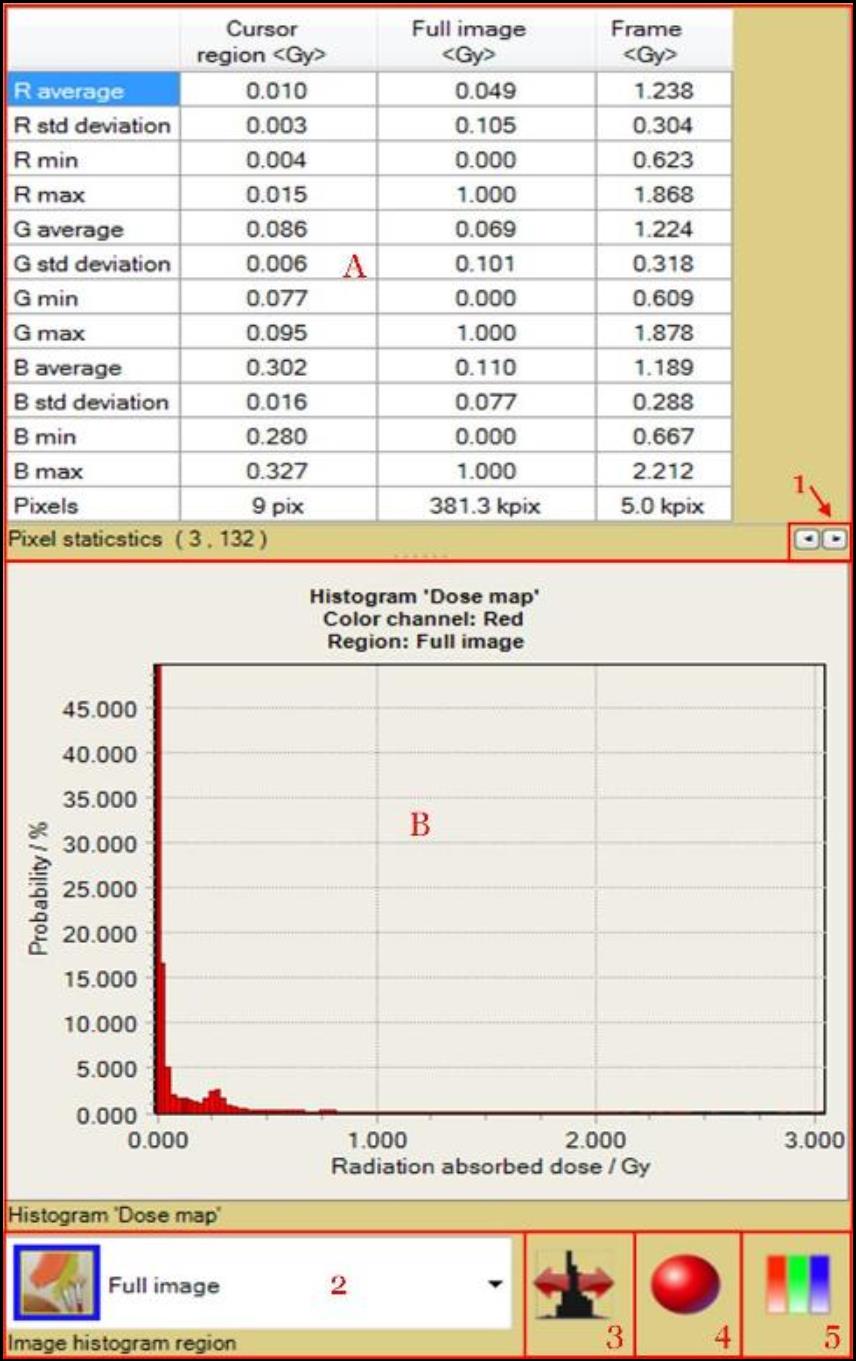
The Statistics Panel is one of the sub-panels of “Film Evaluation Panel.” Click on the third tab to access the “Statistics Panel.” It displays the pixel statistics and histogram of the image shown in the “Image Panel.”
- "Pixel statistics” table displays the pixel information of the image opened in the “Image Panel.”
- Move the cursor around to see the real time tracking of pixel information in “Cursor Region” column. The (#, #) at the bottom of the panel indicates the location of the cursor.
- Under “Case Data Selector,” double click on “Dose map from image (single scan)” and select
- “Data – Dose film” to see the color channel value of the full image and the region selected.
- “Data – Dose map (read only)” to view the dose information of the full image and the region selected.
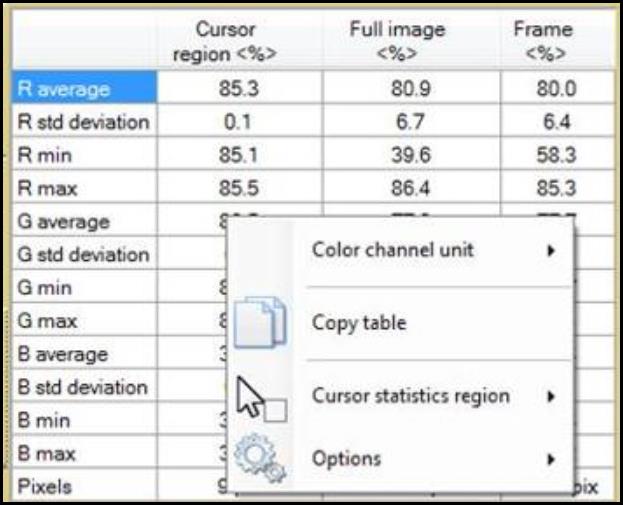
- Right click inside the panel to change the unit of the column and copy the table. Select
- “Cursor statistics region” to change the pixels of the cursor region.
- “Options” to change the configuration of the table.
- “Histogram” shows the bar graph for probability vs. dose or color channel for the image opened in the “Image Panel.”
- Under “Case Data Selector,” double click on “Dose map from image (single scan)” and select
- “Data – Dose film” to see the bar graph for probability vs. color channel value.
- “Data – Dose map (read only)” to view the bar graph for probability vs. dose.
- To zoom in, click and drag a region from top left to bottom right of the preferred region.
- To unzoom, click and drag from bottom right to top left. ·
- Right click and drag to move the histogram to another location. ·
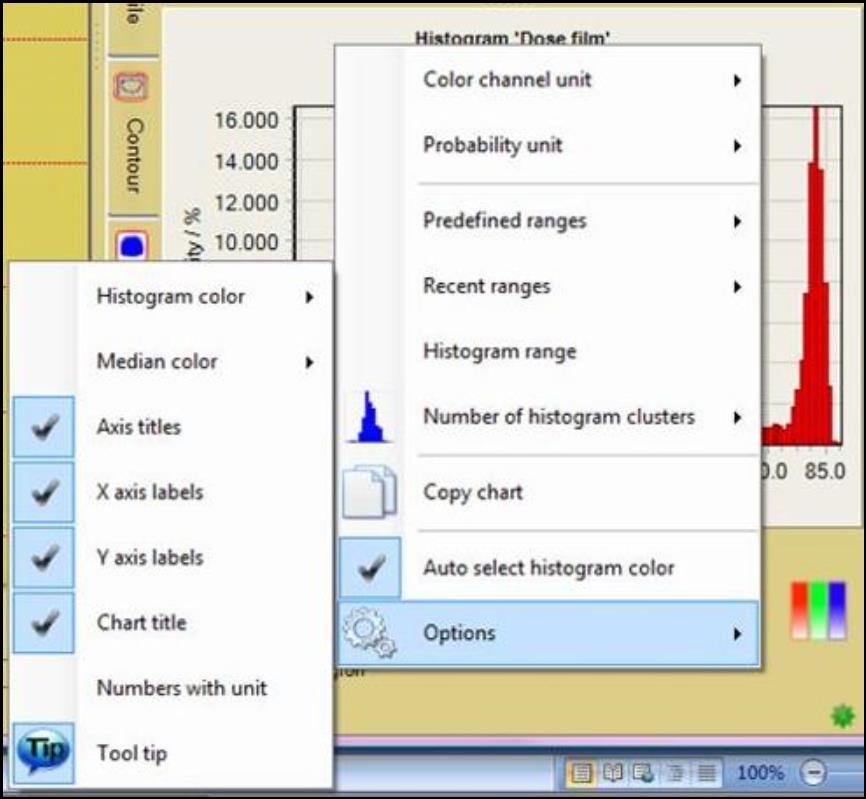
- Right click inside the graph to change the units, the range of x-axis, or the configuration of the graph.
- The “Number Format Buttons” feature allows you to change the format of the number displayed in the window.
- "Image histogram region" drop-down list allows you to select the region of image displayed in "Histogram," B.
- Right click inside the window and check “Simple frame unions” to simply add data of all frames (counts possible overlap regions multiple times). Uncheck the option to count overlap regions only once.
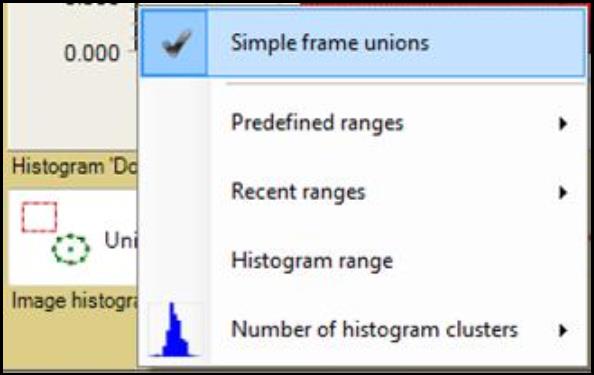
- The "Histogram range" button allows you to toggles between full histogram range (0 ~ 100%) and auto range, i.e., zero clusters at boundaries are trimmed. The icon appears as 14-4.jpg when full range is on and becomes 14-5.jpg when switched to auto range. Select “Histogram range” to manually enter the range preferred. The "Histogram range" button allows you to toggles between full histogram range (0 ~ 100%) and auto range, i.e., zero clusters at boundaries are trimmed. The icon appears as
 when full range is on and becomes
  when switched to auto range. Select "Histogram range" to manually enter the range preferred.
- “Color channel selector” allows you to select the color mapping to calculate the histogram data.
- Click on the button and check “Show pixel value” to enable the selection of other color channels and the display of color channel histogram when “Data – Dose map (read only)” is selected under “Case Data Selector."
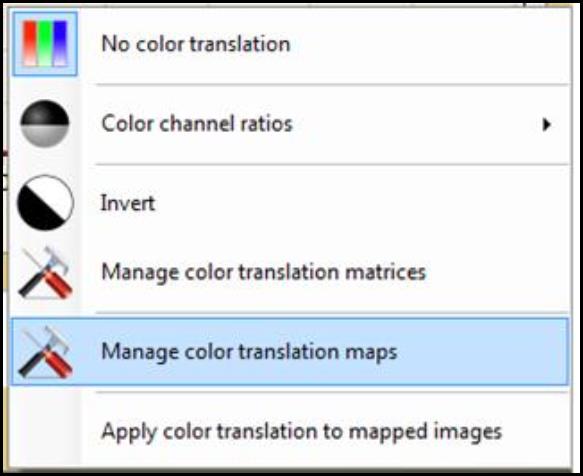
- “Color translation tool” allows you to select a color matrix or color translation that is applied to the pixel values (color) before the histogram data are calculated. Click on the icon and
- Select “Color channel ratios” to divide all color channel values by color selected.
- Select “Invert” to invert color channel values for creating image negative effect.
- Select “Manage color translation matrices” to open the “Bitmap Color Translation Editor.”
- Select “Manage color translation maps” to open the “Color Translation Maps Editor.”
- Check “Apply color translation to mapped images” enables mapping to image that has been mapped, e.g., apply “invert” function when “Data—Dose map (read only)” is displayed in the “Image Panel.”